4. Assess the uncertainty of the estimates using a sample based approach and propagation of confidence intervals
We calculate unbiased estimates and uncertainties using the biomass estimates resulting from the processed image-interpreted samples and their associated sampling weights. Plot a time series of the total biomass estimates for forests with confidence intervals.

Post Processing Notes
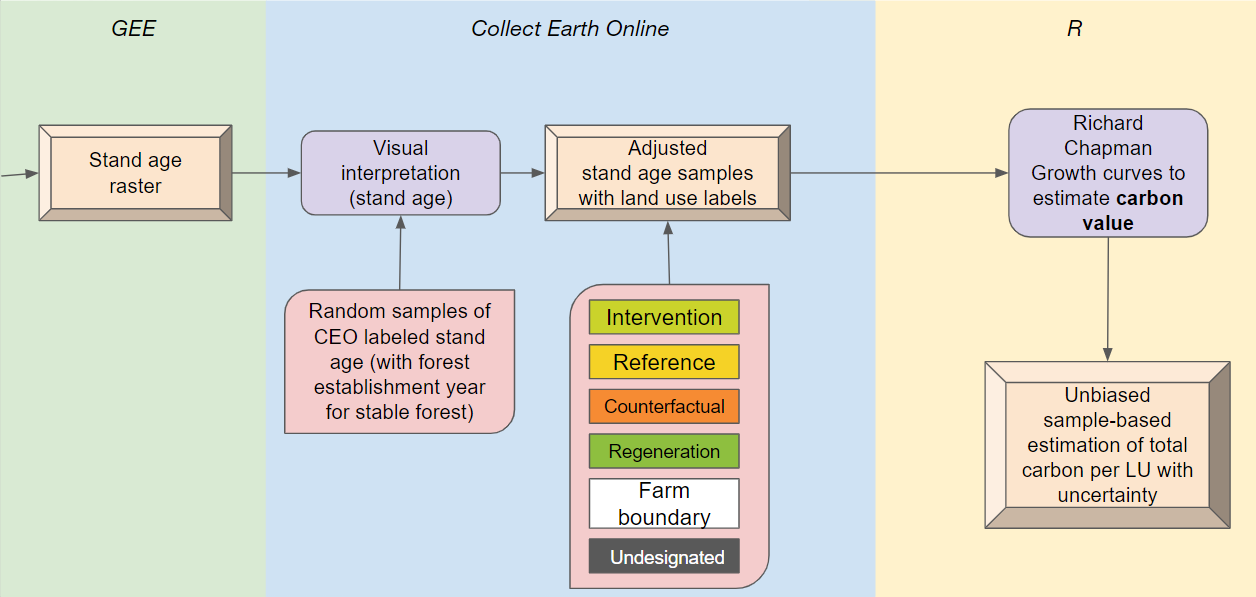
First, we merge information on sample strata and strata weights with the labels for each CEO sample. Then we assign annual stand ages for 1985 - 2021 using answers from CEO questions. Then we estimate carbon storage in above and below-ground biomass to both stand age samples and maps using the forest growth equations.
Accuracy CCURACY ASSESSMENT OF MAPPING PRODUCTS
An independent validation effort was conducted leveraging high- and medium-resolution optical imagery (Planet NICFI mosaics, Google Earth Pro basemaps, Sentinel-2, and Landsat Collections) and ancillary datasets (MapBiomas products, the Global Forest Canopy Height 2019, and NDFI time series) to assess classes on the ground [60-65]. Visual interpretation was done in Collect Earth Online (CEO), a free and open-source web-based tool that facilitates data collection and validation [66-67]. The interpreter utilized a decision tree approach for classifying the validation samples.
For the validation of the disturbance and regeneration maps, the sample points were 30 by 30 meters square, mimicking the map output pixel sizes. The validation of both change maps (disturbance and regeneration) was done using the same set of points. We also used a simple semi-random sampling design with proportional class distribution where we extracted 600 points from both maps, therefore, 100 points for each class: degradation, stable non-forest, stable forest, deforestation, regeneration, different events (Table S1). A “different events” category was used to capture locations where the mapping methods determined a different class for the same location. This class can include regeneration events on non-forest areas followed by degradation or deforestation or disturbance events, most likely deforestation, followed by regeneration. The accuracy metrics (overall, user, and producer accuracies) and unbiased area estimates for each class were calculated through the ratio estimator approach [68] for when the strata are different from the map classes since we used the same sample points for disturbance map and regeneration map.
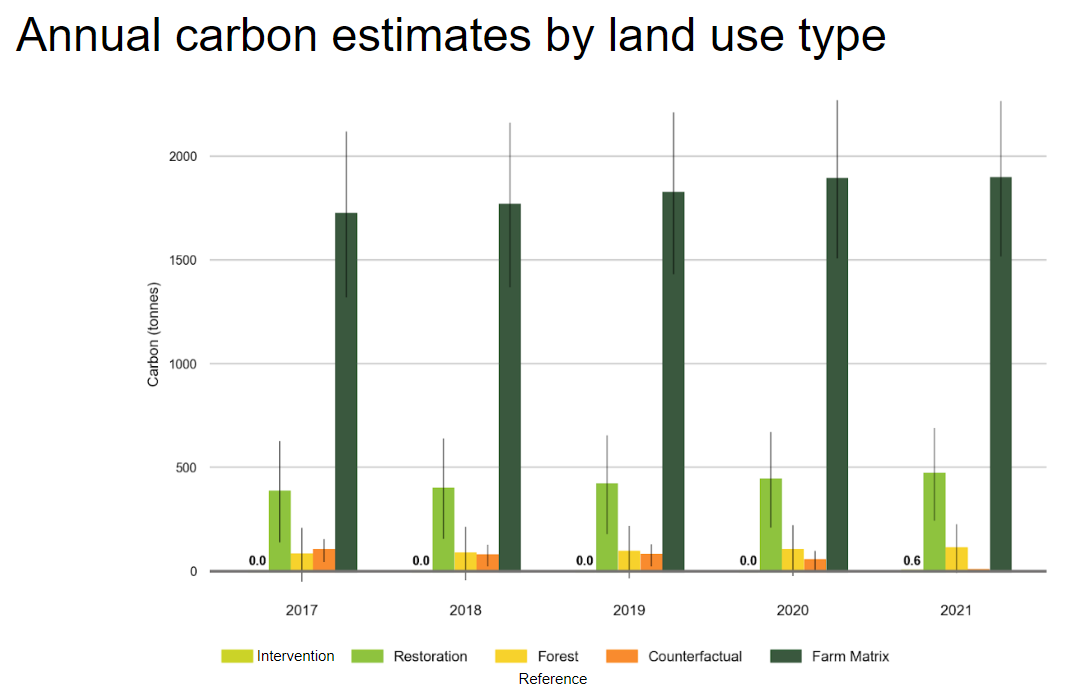
### Calculate unbiased estimates and uncertainties using the carbon values resulting from the interpreted samples and their associated sampling weights. Plot a time series of the total carbon estimates and uncertainties for the study farms. Repeat for each land use type. This is currently done in R.
Example Results
The dark green line is the estimate of the amount of carbon over time The shaded light green regions are the +/- 95% confidence intervals due to the uncertainty from the sample-based C storage estimation.


Accuracy CCURACY ASSESSMENT OF MAPPING PRODUCTS
An independent validation effort was conducted leveraging high- and medium-resolution optical imagery (Planet NICFI mosaics, Google Earth Pro basemaps, Sentinel-2, and Landsat Collections) and ancillary datasets (MapBiomas products, the Global Forest Canopy Height 2019, and NDFI time series) to assess classes on the ground [60-65]. Visual interpretation was done in Collect Earth Online (CEO), a free and open-source web-based tool that facilitates data collection and validation [66-67]. The interpreter utilized a decision tree approach for classifying the validation samples.
For the validation of the disturbance and regeneration maps, the sample points were 30 by 30 meters square, mimicking the map output pixel sizes. The validation of both change maps (disturbance and regeneration) was done using the same set of points. We also used a simple semi-random sampling design with proportional class distribution where we extracted 600 points from both maps, therefore, 100 points for each class: degradation, stable non-forest, stable forest, deforestation, regeneration, different events (Table S1). A “different events” category was used to capture locations where the mapping methods determined a different class for the same location. This class can include regeneration events on non-forest areas followed by degradation or deforestation or disturbance events, most likely deforestation, followed by regeneration. The accuracy metrics (overall, user, and producer accuracies) and unbiased area estimates for each class were calculated through the ratio estimator approach [68] for when the strata are different from the map classes since we used the same sample points for disturbance map and regeneration map.
Farr, T. G. et al., 2007, The Shuttle Radar Topography Mission, Rev. Geophys., 45, RG2004, doi:10.1029/2005RG000183
- Olofsson, Pontus, et al. “Good practices for estimating area and assessing accuracy of land change.” Remote Sensing of Environment 148 (2014): 42-57. https://doi.org/10.1016/j.rse.2014.02.015.
- ESA, 2015. SENTINEL-2 User Handbook, vol. 1, pp. 64.
- Buchhorn, M., Lesiv, M., Tsendbazar, N. E., Herold, M., Bertels, L., and Smets, B. (2020). Copernicus global land cover layers—collection 2. Remote Sensing, 12(6), 1044.
- Planet. (2021) Planet and NICFI partnership data
- Potapov, P., Li, X., Hernandez-Serna, A., Tyukavina, A., Hansen, M. C., Kommareddy, A., … and Hofton, M. (2021). Mapping global forest canopy height through integration of GEDI and Landsat data. Remote Sensing of Environment, 253, 112165.
- Bey, A., Sánchez-Paus Díaz, A., Maniatis, D., Marchi, G., Mollicone, D., Ricci, S., … and Miceli, G. (2016). Collect earth: Land use and land cover assessment through augmented visual interpretation. Remote Sensing, 8(10), 807.
- Saah, D., Johnson, G., Ashmall, B., Tondapu, G., Tenneson, K., Patterson, M., … and Chishtie, F. (2019). Collect Earth: An online tool for systematic reference data collection in land cover and use applications. Environmental Modelling and Software, 118, 166- 171.
- Stehman, S. V. (2014). Estimating area and map accuracy for stratified random sampling when the strata are different from the map classes. International Journal of Remote Sensing, 35(13), 4923-4939.