Café Apuí (Amazonia Agroflorestal)
Amazonia Agroflorestal is supporting and expanding the adoption of organic agroforestry systems for coffee production.
According to 2020 values estimated by the national spatial research institute INPE (per its acronym in Portuguese), deforestation in the state of Amazonas has almost tripled from 1990 to 2000, to 2010 to 2019. Under this scenario, Amazonia Agroflorestal is supporting and expanding the adoption of organic agroforestry systems for coffee production. In 2022, a total of 43 farmers were engaged in the initiative, but only a few have established shaded agroforestry systems (SAF). As per the agroforestry systems, the majority of the coffee plots were being implemented in 2022.
Links to Documents and Resources
Draft Reports
- Draft: Café Apuí Report (google doc, v2)
- Draft: Café Apuí Report (google doc, v1)
-
Foundational Report Cafe Apui - Google Docs
- Draft: Café Apuí Report, year 2 for testing (google doc, v1)
Resources
- Remote sensing data dictionary: TerraBio RS - Data Dictionary - Cafe Apui
- Script repositories
- google drive
- Cafe Apui Documents
- Maps shared by Cafe Apui
Sample Design for Image Interpretation
- notes doc
- Notes on Cafe Apui yr1 Sample Design
- CEO sample design: link to sample design GEE script
- Carbon calculations require SIMPLE random sampling, However, we need a minimum number per change strata (33). May densify in other classes later. Cafe Apui yr1 Sample Design Notes
- Carbon metric methodology document
Image Interpretation
- CEO updated version of project
- Link to CEO project(s)
- CEO Interpretation Key for Cafe Apui 2022
- CEO setup instructions/log - TerraBio CEO validation set up instructions
Location
The Apuí municipality where Café Apuí is produced is located in the South region of the state of Amazonas in Brazil. The region is a high deforestation risk zone ranking third in the state. According to 2020 values estimated by the national spatial research institute INPE (per its acronym in Portuguese), deforestation in the state itself has almost tripled from 1990 to 2000, to 2010 to 2019.
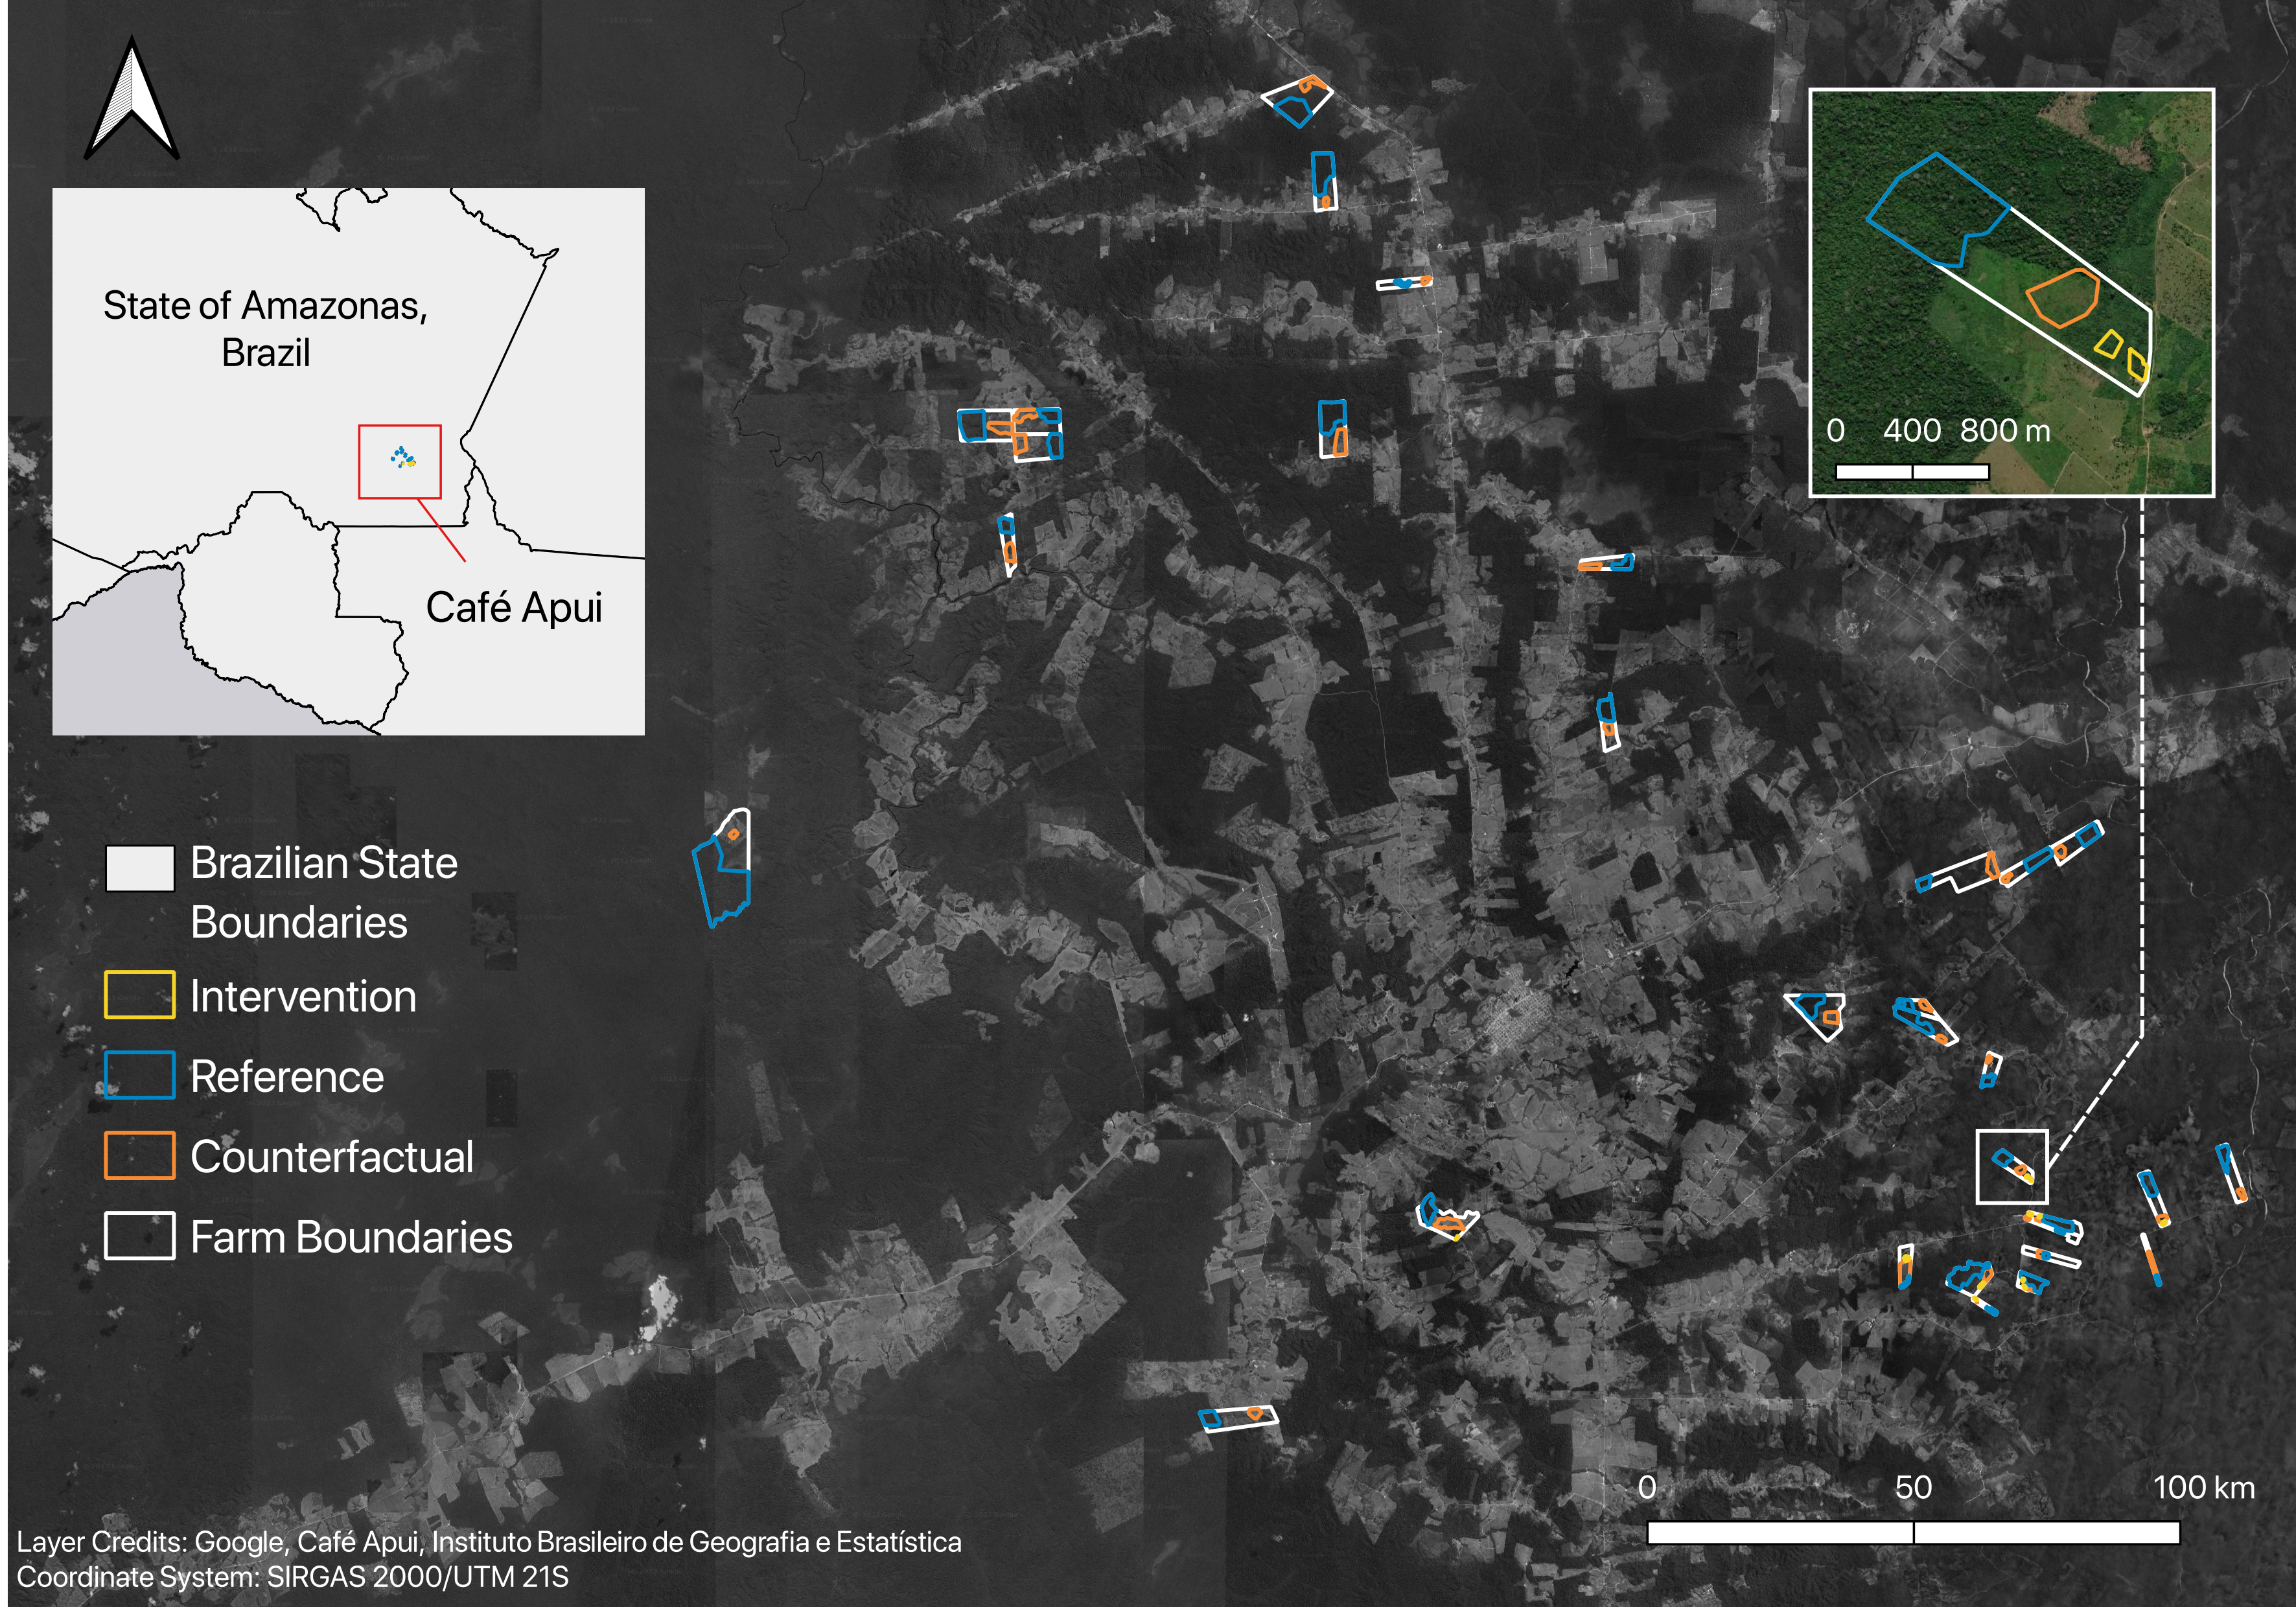
 Figure 1. Location of some Cafe Apui farms in the Ralino vicinal in Apuí, State of Amazonas, Brazil.
Amazonia Agroflorestal is supporting and expanding the adoption of organic agroforestry systems for coffee production. In 2022, a total of 43 farmers were engaged in the initiative, but only a few have established shaded agroforestry systems (SAF). The majority of the coffee plots were being implemented as agroforestry systems in 2022.
The average farm size is 130 ha, and the average coffee agroforestry system is 1.8 ha, roughly representing about 1.3% of the farm area. In addition to the agroforestry system, forest areas across Cafe Apui farms have an average size of about 77 ha, representing approximately 60% of the property area.
Land Uses / Geographic Reporting Units
The land uses we include in the design of TerraBio include:
- Reference: Conserved forested area characterized by native trees.
- Counterfactual: Practice followed if no intervention. E.g. pasture land, soy plantation.
- degraded pasture
- secondary succession
- Intervention Type(s): Cafe Apui’s intervention type is agroforestry, specifically shaded agroforestry systems.
- Undesignated: Note, not all areas in a farm will fall under these categories. We refer to this area in the farm that is not included as an intervention, reference or counterfactual as undesignated.
Farm boundary(ies): Includes the farm boundaries under the deal. It usually encompasses all the other land uses, but it can happen that one land use is not within the farm boundaries.
Intervention Details (SAF)
Organic shaded coffee is produced in farmer property areas of one to three hectares. The coffee trees are planted at a density of 6 by 2 meters, and frequently mixed with guarana production planted in rows of 6 by 4 meters. The agroforestry systems promoted by Cafe Apui includes additional multipurpose species for soil nutrient enrichment such as beans and soil cover such as crotalaria species. As shade, Cafe Apui systems promote the use of timber species such as Andiroba, Cedro Itaube, Jatoba, Ipe Amarelho at a density of 10 by 10 meters. Additional production species could be introduced at different coffee growth stages including intercropping with cassava, maize, melon, passion fruit shrubs, and banana palms.
Secondary Succession/Fallow Area Details (Succession)
Fallow areas within farms were assessed in Café Apuí as these land cover areas are likely converted into the project’s shaded agroforestry systems. Fallow areas are abandoned plots where secondary succession processes are taking place, returning previously forest-cleared areas back into forest-like ecosystems. This natural process is slow and dependent on multiple factors including the dispersion of seeds and early successional species in the landscape. At the Café Apuí farms assessed, fallow areas are locally called “Juquiras” or “Capoeiras”. Their fallow periods can vary from 3 to 8 years, and the older systems can include softwood tree species, palms, shrubs and grass vegetation.
Forest Reference Details
Forest areas are used in TerraBio as reference sites to compare biodiversity data and to monitor land cover degradation and/or deforestation. Within the properties engaged in Cafe Apui, forest conservation areas are assessed for soil collection. Conservation areas within properties can be considered secondary forests following previous deforestation processes. At the assessed Café Apuí farms in 2022, the secondary forest areas had closed canopies and established trees with varying heights between 10 to 20 meters. The understory was densely composed of shrubs and palms, and the soil was fully covered with a thick layer of leaf litter.
Pasture Details (Pasture)
Low intensity pastures for cattle grazing are the dominant land use system in the Apuí landscape. Brachiaria species are commonly used for animal grazing, and the pastures are managed with fire regimes. The pastures assessed within CAfe Apui farms showed little organic matter content and were very rocky. Soil cover with grass or shrub vegetation was patchy with high incidence of exposed soil areas.
Remote Sensing Indicators and Hypothesis
Table 1. Summary of Indicators and Metrics
| ABF KPI | TerraBio metric | reporting unit | measurement units |
|---|---|---|---|
| CO2 e Reduction | Carbon Sequestration - Emission Reductions | farm boundary and by land use | normalized by area (T C/ha - confirm units) |
| Improved Biophysical Conditions | Regenerated/Restored Area | within intervention sites and farm total | Total ha |
| Landscape Conservation | Conserved Forest Area | farm boundary, excluding intervention | Total ha |
| Habitat Protection | Change in Patch Connectivity | farm boundary | percent area change per class |

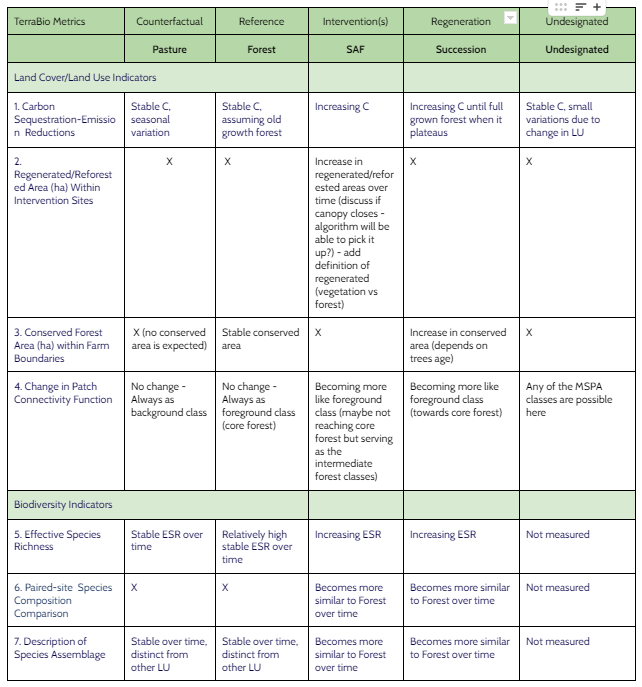
Figure 2. Hypothesis of the impact of Cafe Apui interventions for each of the TerraBio metrics.
Sample Design
Sample Design for Field Data Collection
In 2022, the majority of the coffee agroforestry interventions were being implemented. Thus, 2022 soil data collection focused on farms with established coffee production systems. Five established coffee agroforestry systems were sampled, along with four Juquira systems (fallow regenerating forest), four forest sites (control), and three pasture sites (counterfactual). Three replicates were collected at each site for a total of 48 samples.
- Juquira: 4, Floresta: 4 Pasto: 3 SAF: 5
Sample Design for Image Interpretation
We first generated a simple random sample of 139 points within farm boundaries. We arrived at this number by counting the minimum number of points (33) needed per loss strate (of which there are 4: stable forest, deforested, degraded, non-forest), with a 5% buffer. We then densified this initial sample to meet the data needs prescribed by each metric:
- Carbon Sequestration - Emission Reductions: 35 points per land use (counterfactual, intervention, reference)
- Regenerated/Restored Area: 35 points per gain stratum (gain, no gain) within the intervention sites
- Conserved Forest Area: 35 points per loss stratum within farms, excluding intervention sites
In the case of Cafe Apui, this involved adding additional random points within the counterfactual sites and per gain stratum within the intervention sites, resulting in a total of 270 sample points.
Sample Design Summary by Indicator
Areas of land uses:
- Intervention Details (SAF): 155 pixels,
- Forest Reference Details: 16,092 pixels
- Pasture Details (Pasture): 4,473 pixels
- Undesignated: 23,574 pixels
?. Secondary Succession/Fallow Area Details (Succession):
1. CO2 e Reduction - farm boundary and by land use - normalized by area (T C/ha - confirm units)
2. Improved Biophysical Conditions (Regenerated/Restored Area)
(including points from initial random sampling and those stratified by the gain map within the intervention)
| Map Strata | # of Pixels | # of Points |
|---|---|---|
| Gain | 24 | 35 |
| No Gain | 131 | 24 |
(including points from initial random sampling and those stratified by the gain map)
| Map Strata | # of Pixels | # of Points |
|---|---|---|
| Gain | 4081 | 33 |
| No Gain | 40209 | 123 |
– confusion matrix of farm
3. Landscape Conservation (Conserved Forest Area)
(includes points from initial random sampling and those stratified by the loss map) | Map Strata | # of Pixels | # of Points | |:—: |:—: |— | | stable forest | 23977 | 72 | | degradation | 1430 | 33 | | deforestation | 5851 | 33 | | non-forest | 12877 | 45 |
-
Within the whole farm
(includes points from initial random sampling and those stratified by the loss map)
| Map Strata | # of Pixels | # of Points |
|---|---|---|
| stable forest | 23990 | 72 |
| degradation | 1431 | 33 |
| deforestation | 5898 | 33 |
| non-forest | 12971 | 46 |
Visit resources below for more details:
- Notes on Cafe Apui yr1 Sample Design
- CEO sample design: link to sample design GEE script
Image Interpretation
- CEO updated version of project
- Link to CEO project(s)
- CEO Interpretation Key for Cafe Apui 2022
- CEO setup instructions/log - TerraBio CEO validation set up instructions
- CEO interpreters: luis.molina@cgiar.org, jhoanse@gmail.com
- QA/QC procedures: No duplicates, only review of low confidence interpretations
CEO survey questions:
Contact Information
- IDESAM: https://idesam.org/en/
- Thiago Marinho thiago.marinho@idesam.org - GIS Analyst
- Gabriel Carrero gabriel.carrero@idesam.org - Associate Senior Researcher
- Victoria Bastos victoria.bastos@idesam.org - Leader at the Environmental Services and Carbon Neutral Program Initiative
- Elen Perez elen.perez@idesam.org - Project Manager of the Strategic Environmental Services Initiative and Carbon Neutral Program
- Marina Reia marina.reia@idesam.org - Consultant, Field work Coordinator