3. Apply growth curve functions
We apply growth curve functions developed for our region of interest based on published studies Bernal et al. (2018). The biomass accumulation curves were developed for a set of FLR activities (natural regeneration, planted forests and woodlots, agroforestry, and mangrove restoration) with corresponding confidence intervals, grouped by FLR activity and region/climate.
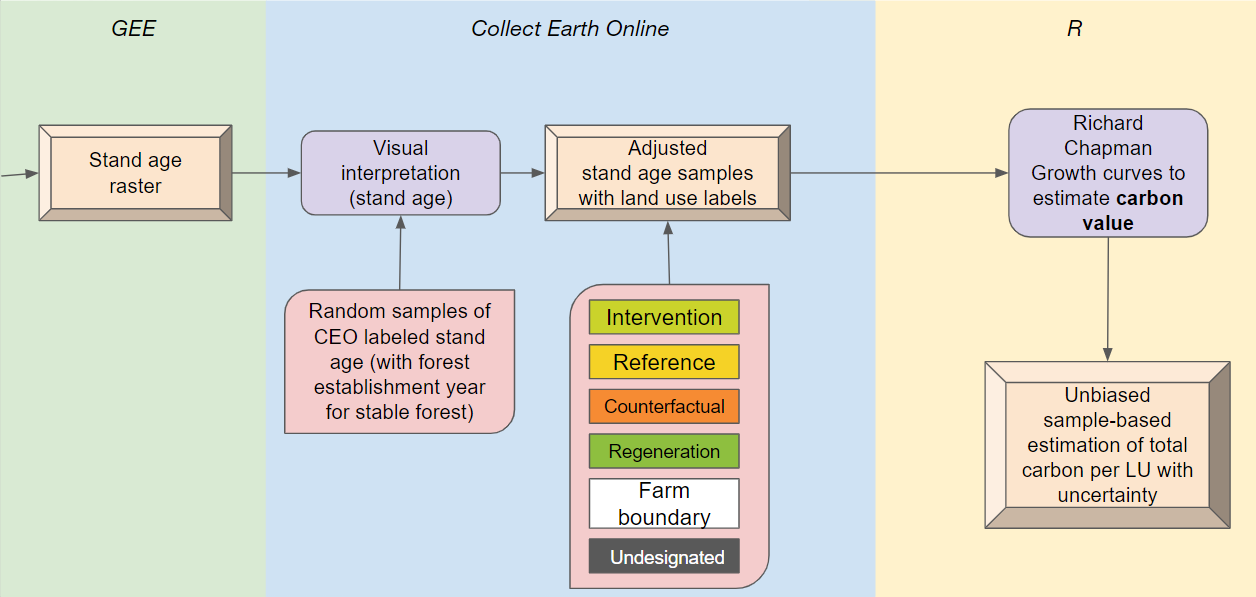
The growth curves are based on the Richard Chapman function to model the smooth change of Carbon stock in above and below ground biomass with increasing age of a forest. This function provides carbon values for young regrowing forests and mature stands. There are different curve specifications for different forest types
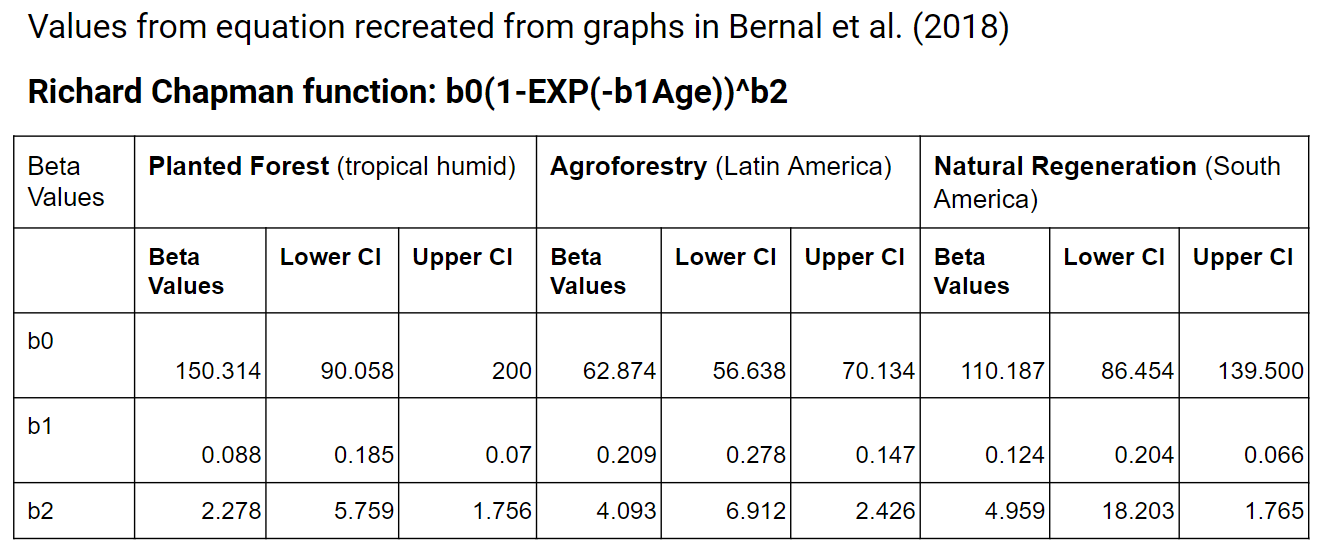
Equation (from Bernal 2018): Biomass = b0(1-EXP(-b1Age))^b2
The growth curves are plotted from Bernal in the images below. 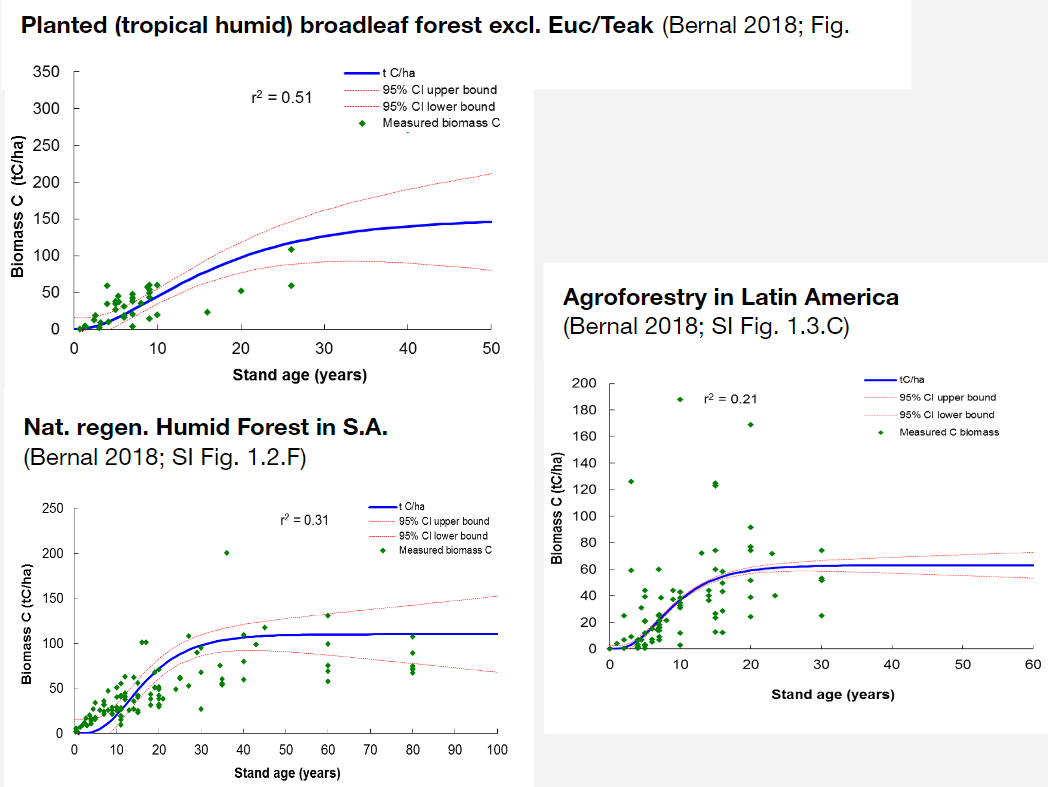
Forest Types
The growth curve that should be used depends on the forest system of interest. There are three South American studies that have been summarized and presented in the Bernal paper that we use to calculate carbon for TerraBio. These include:
1.1.D. Planted Forest (tropical humid) - Broad leaf, excluding eucalyptus and teak Figure 1.1.D. Growth curves developed for planted forests and woodlots of broadleaf excluding teak and eucalyptus (e.g., Populus sp., Gmelina sp., or Leucaena sp., among others), under boreal, temperate humid and dry, tropical humid, and tropical dry climates. The curves indicate biomass carbon stock (tons C ha-1) per stand age (years), upper and lower bounds of the 95% confidence interval (CI), and goodness of fit (R2)
1.2.F. Natural Regeneration - South America Figure 1.2.F. Growth curves developed for naturally regenerated forests in South America under humid and dry climates. The curves indicate biomass carbon stock (tons C ha-1) per stand age (years), upper and lower bounds of the 95% confidence interval (CI), and goodness of fit (R2).
1.3.C. Agroforestry - Latin America and the Caribbean Figure 1.3.C. Growth curves developed for agroforestry in Latin America and the Caribbean. The curve indicates biomass carbon stock (tons C ha-1) per stand age (years), upper and lower bounds of the 95% confidence interval (CI), and goodness of fit (R2).
Coefficients
The coefficient values from the equations for these three forest types are as follows (see image below).
- Calculate carbon in tonnes per hectare based on the stand age using the growth curve function(s).
- This creates a smooth change of carbon stock with increasing age of forest, including for young forests. Note that the confidence intervals change with age, and the curves differ depending on forest type.
Historic Notes
Appendix Notes
Carbon look up table for non-forests
In case we have time and budget to integrate a process to improve our carbon estimates coming from non-tree cover, we can reference this work:
- Tenneson, K., Patterson, M.S., Jadin, J., Rosenstock, T., Mulia, R., Kim, J., Quyen, N., Poortinga, A., Nguyen, M.P., Bogle, S., Dilger, J., Marlay, S., Nguyen, Q.T., Chishtie, F., and D. Saah. 2021. Commodity-Driven Forest Loss: A Study of Southeast Asia. Washington DC. 196pp. report
See also