Sampling Design using SEPAL
These instructions are adapted from OpenMRV.
We will use the SEPAL Stratified Area Estimator (SAE)-Design tool to distribute sample points usind a stratified random sampling approach. The SAE-Design tool will generate a set of stratified random points that are placed in each of the different map classes (which we will now call strata) represented in your map.
A video-tutorial is available in this YouTube video.
Pre-requisites
- A SEPAL account and a Collect Earth Online (CEO) account.
- A previously generated map to use for stratification.
- For this workshop, you will need to first download the map to your local machine, and then upload it to SEPAL following the instructions below.
- If you have a large Area of Interest (AOI), you may need to first increase the size of your instance for faster processing (see
Terminalsection here).
1. Uploading your stratification map
You will need to upload a stratification map to SEPAL.
There are two tools that can be used to upload files. The first is RStudio, and the second is the File transfer Management app.
For either approach, first select the purple wrench Apps button. If you have an existing tab open, you may need to click the plus sign in the top right.
To use RStudio, choose the R Studio application.
a. You may be prompted to enter your SEPAL username and password to enter R Studio.
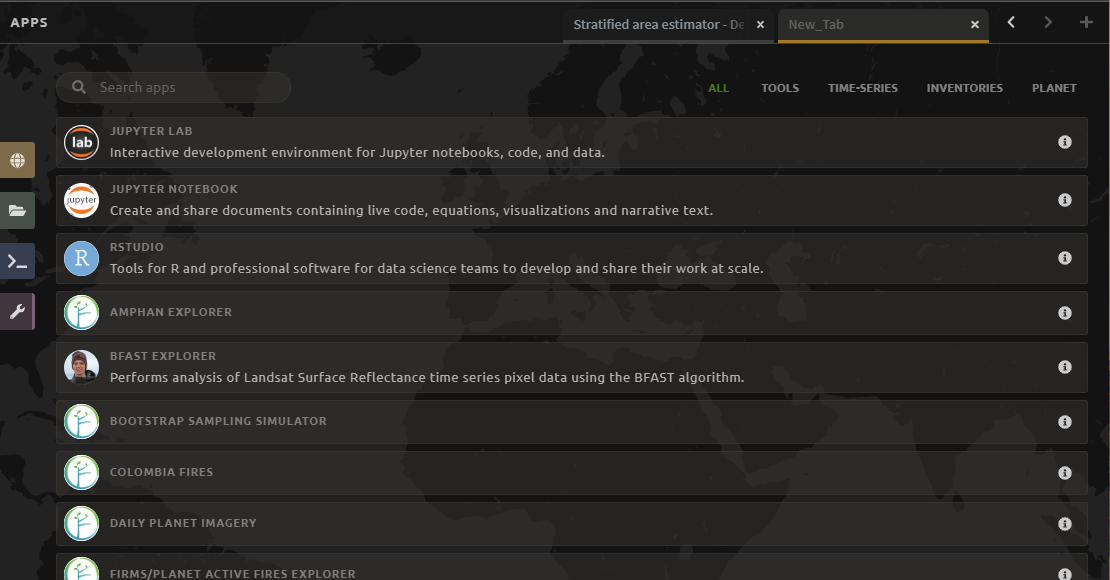
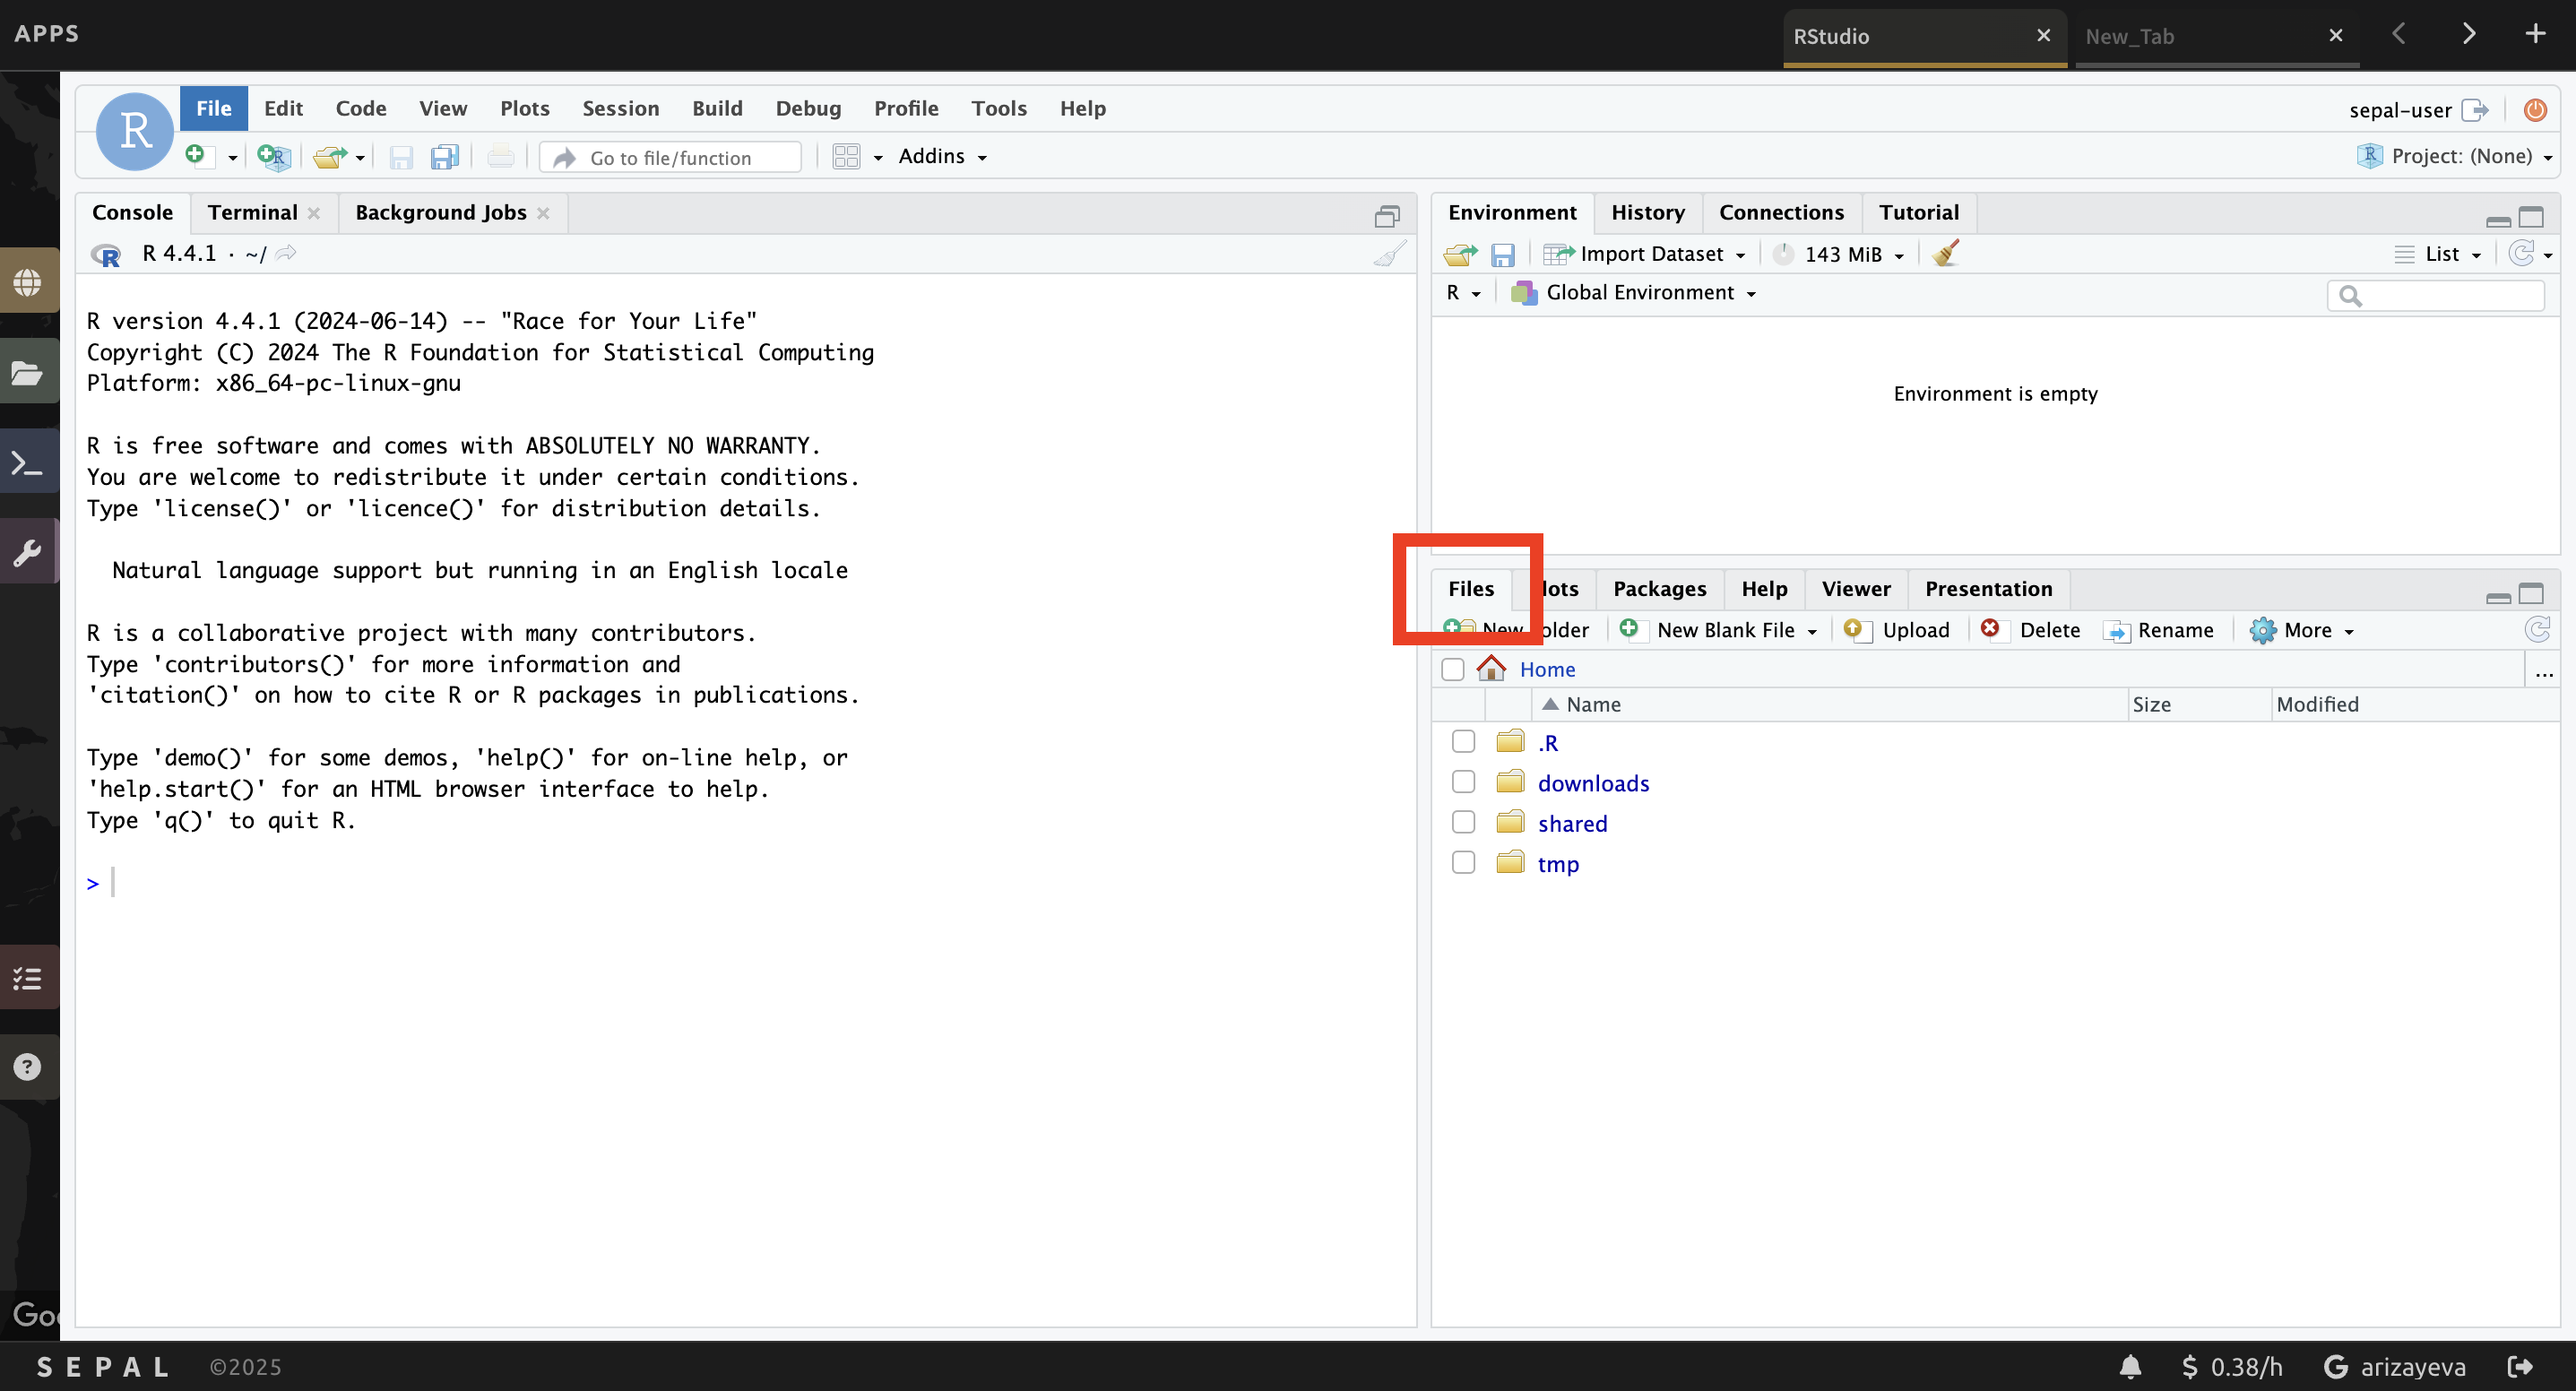
b. This will open an instance of RStudio, an IDE for the R programming language.
c. You should see a Files tab in the lower right window.
If not, you may need to adjust the window layout. To do this, move your mouse to the right-hand side of the window where a four-way arrow will appear. Click and drag your mouse to the left to reveal the right pane.
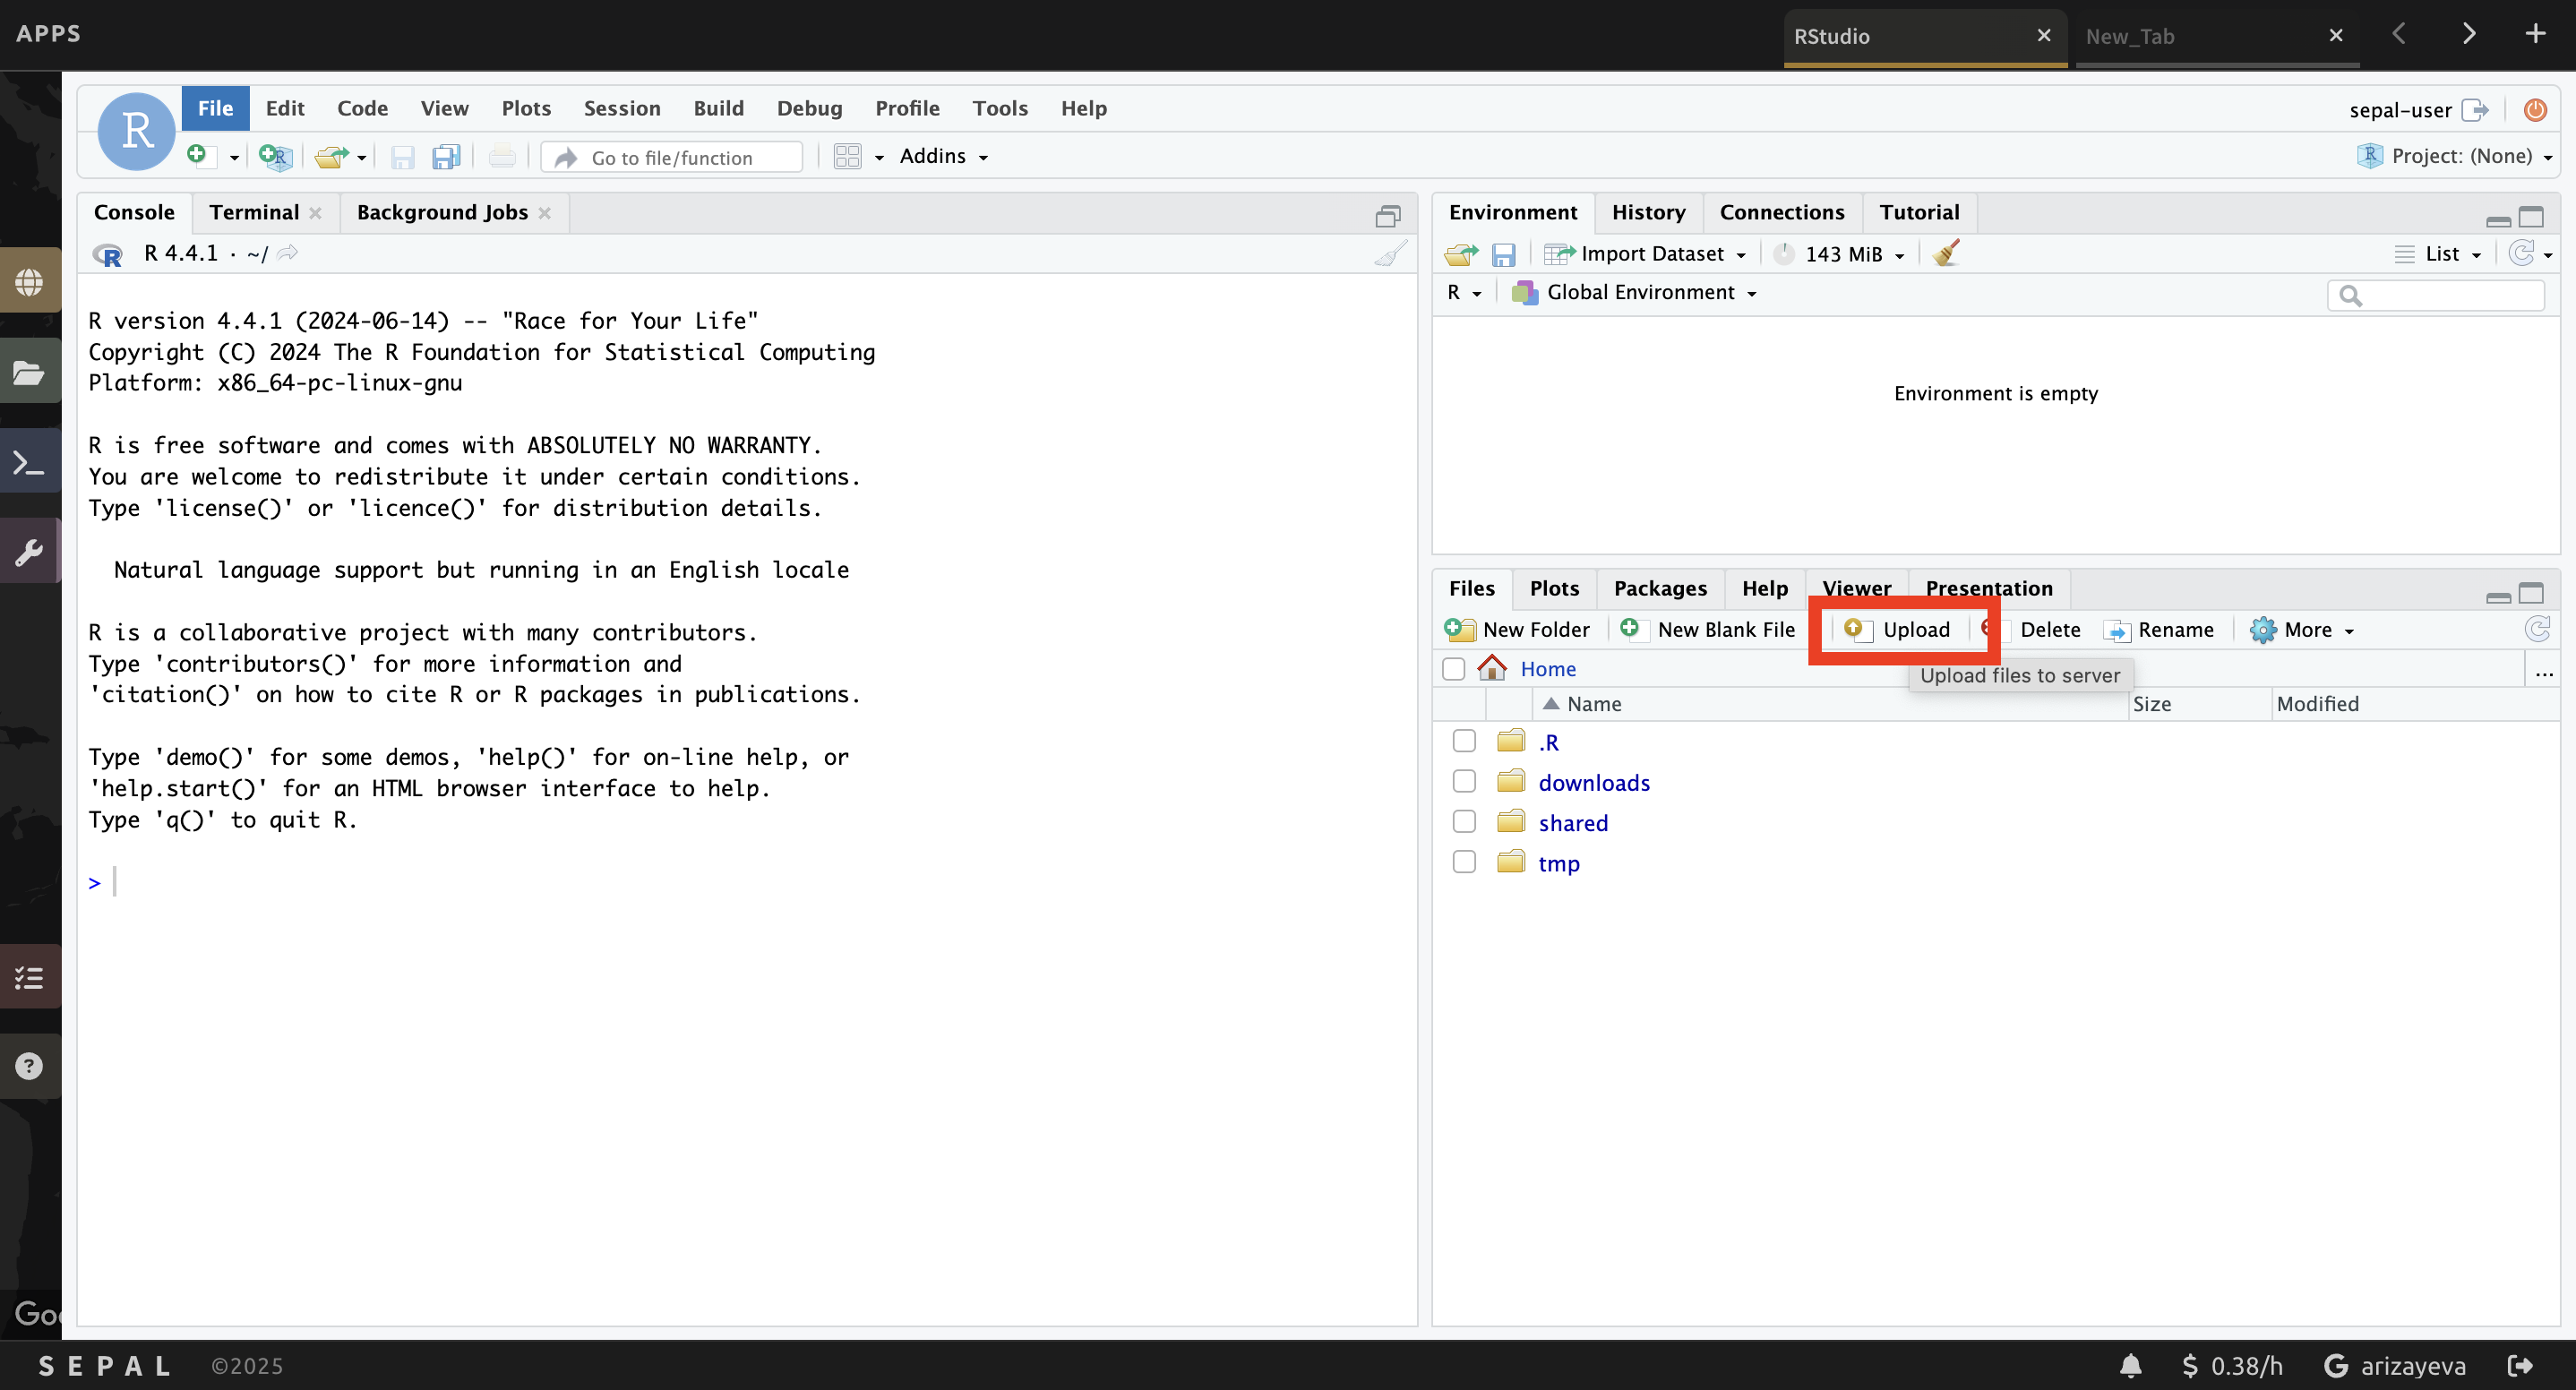
d. Click the Upload button that is located in the lower right side of the R Studio interface (see below).
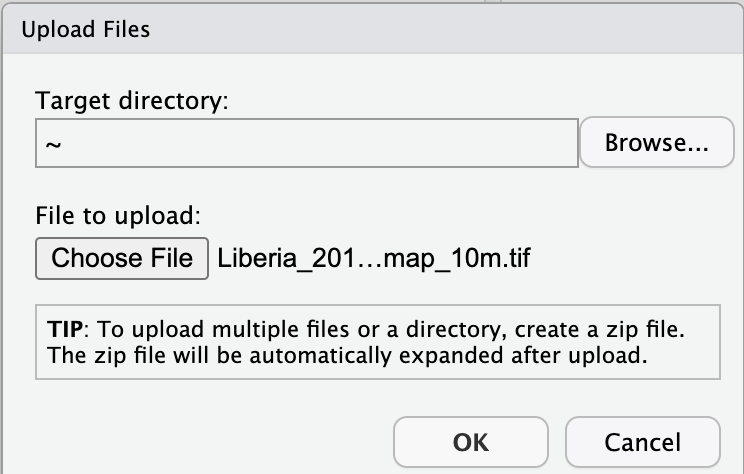
e. In the Upload Files window, click Choose File.
f. Navigate to the correct location on your drive, select your map and click Open.
g. Once you’ve selected this file, click OK to complete the upload.
h. You will see your file appear in the list of files in the lower right-hand pane.
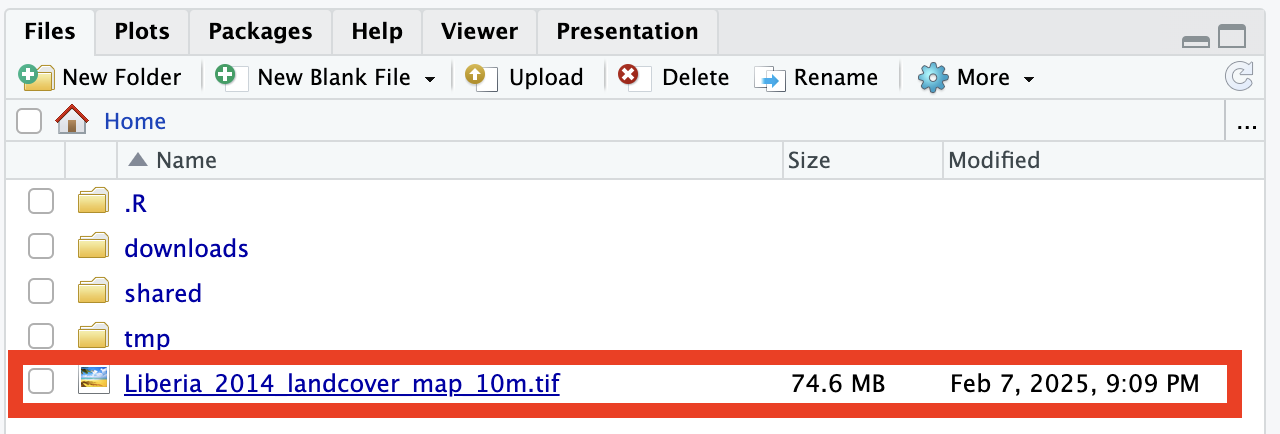
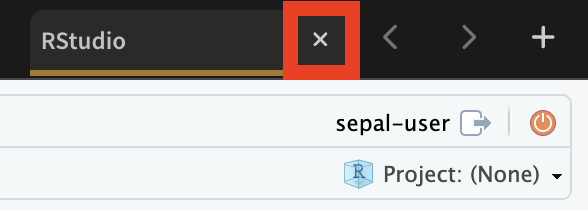
i. You may now close the RStudio instance by clicking the tab’s x.
To use the File transfer manager, select the File transfer management application.
a. Under Upload to Sepal, click on the drop down Select table type menu. Click on the correct file type for your map.
b. Click on the paperclip icon.
c. Navigate to the correct location of your map on your drive, select your map and click Open.
d. Click Import
2. Creating a stratified random sample
NOTE:
You can view a demonstration of creating a stratification on this YouTube demo video.
Part 1: Creating a stratified random sample
We will use SEPAL to create a stratified random sample. To begin, you can use the test dataset available in SEPAL or you can use a raster of your classification loaded into SEPAL using the instructions in Part 1.
A well-prepared sample can provide a robust estimate of the parameters of interest for the population (percent forest cover, for example). The goal of a sample is to provide an unbiased estimate of some population measure (e.g. proportion of area), with the smallest variance possible, given constraints including resource availability. Two things to think about for sample design are: do you have a probability based sample design? That is, does every sample location have some probability of being sampled? And second, is it geographically balanced? That is, are all regions in the study area represented.
These directions will provide a stratified random sample of the proper sampling size:
1. First, navigate to https://sepal.io/ and sign in.
2. Select the Apps button (purple wrench).
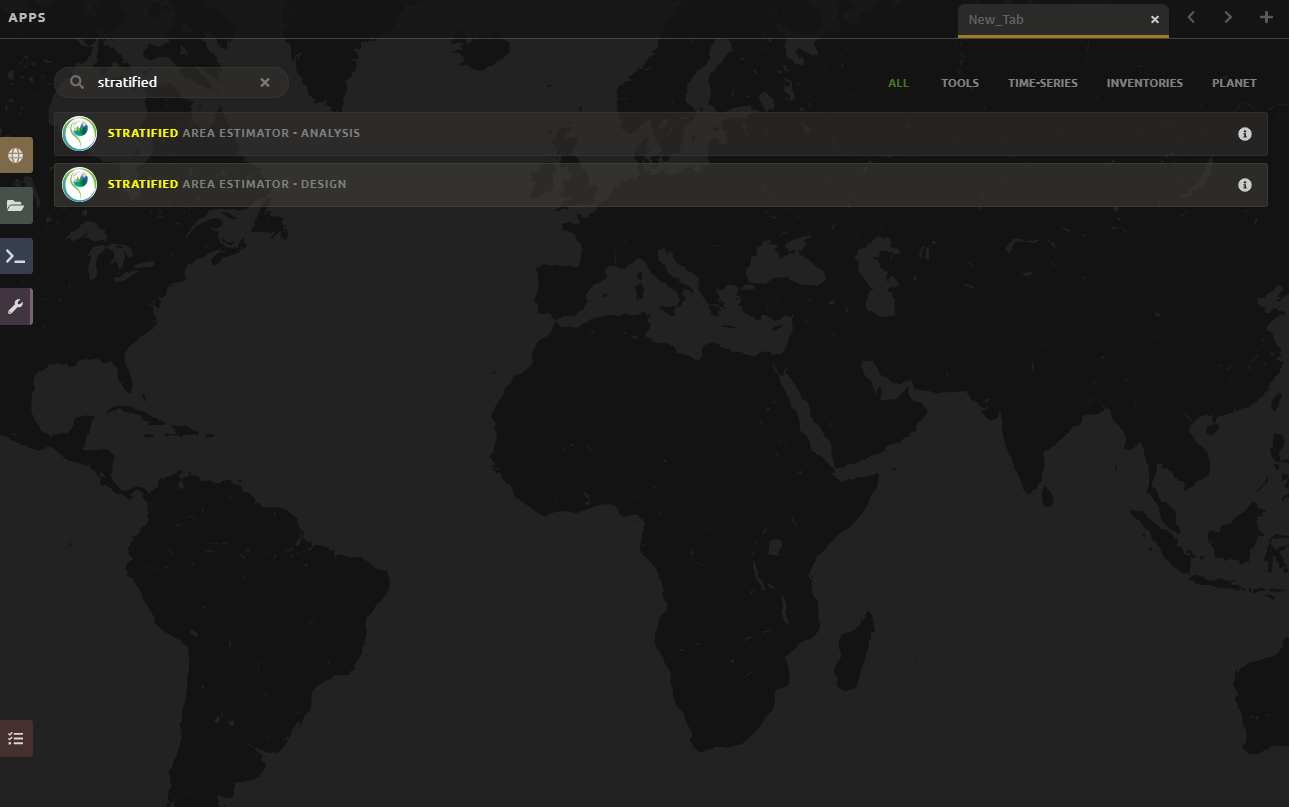
3. Type ‘stratified’ into the search bar or scroll through the different process apps to find “Stratified Area Estimator–Design”.
4. Select Stratified Area Estimator-Design. Note that loading the tool takes a few minutes.
NOTE:
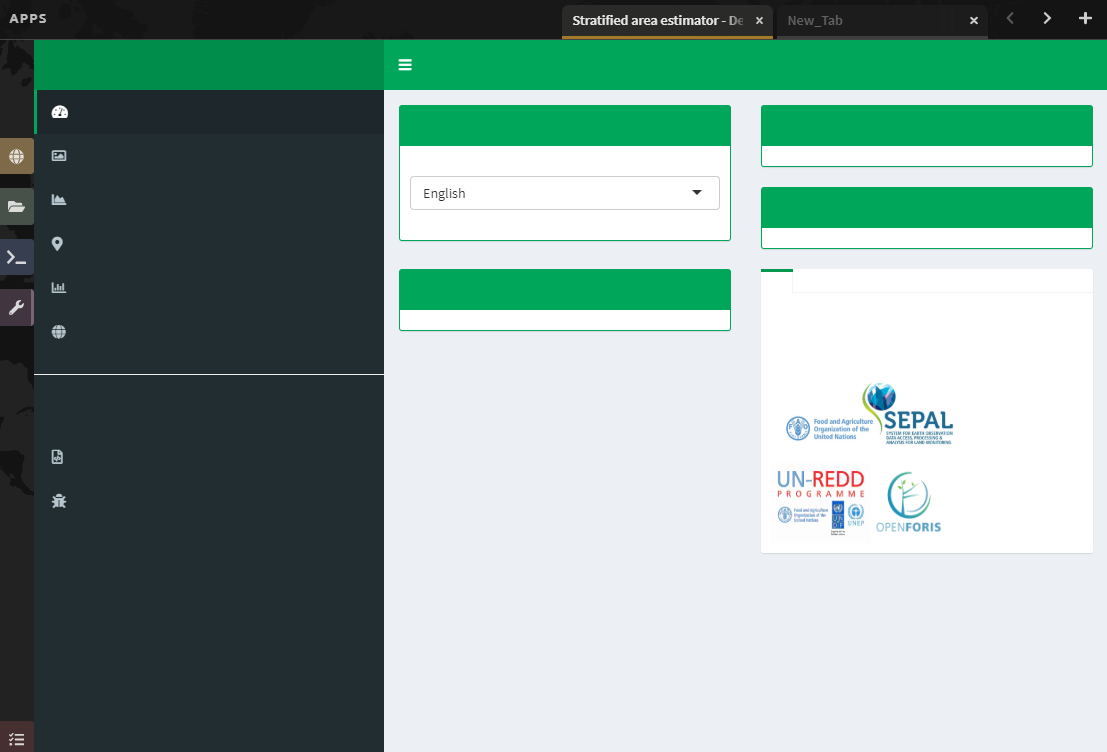
Sometimes the tool fails to load properly (none of the text loads) as seen below. In this case, please close the tab and repeat the above steps.
5. When the tool loads properly, it will look like the image below. Read some of the information on the Introduction page to acquaint yourself with the tool.
a. On the Introduction page, you can change the language from English to French or Spanish.
b. The Description, Background, and ‘How to use the tool’ panels provide more information about the tool.
c. The Reference and Documents panel provides links to other information about stratified sampling, such as REDD Compass.
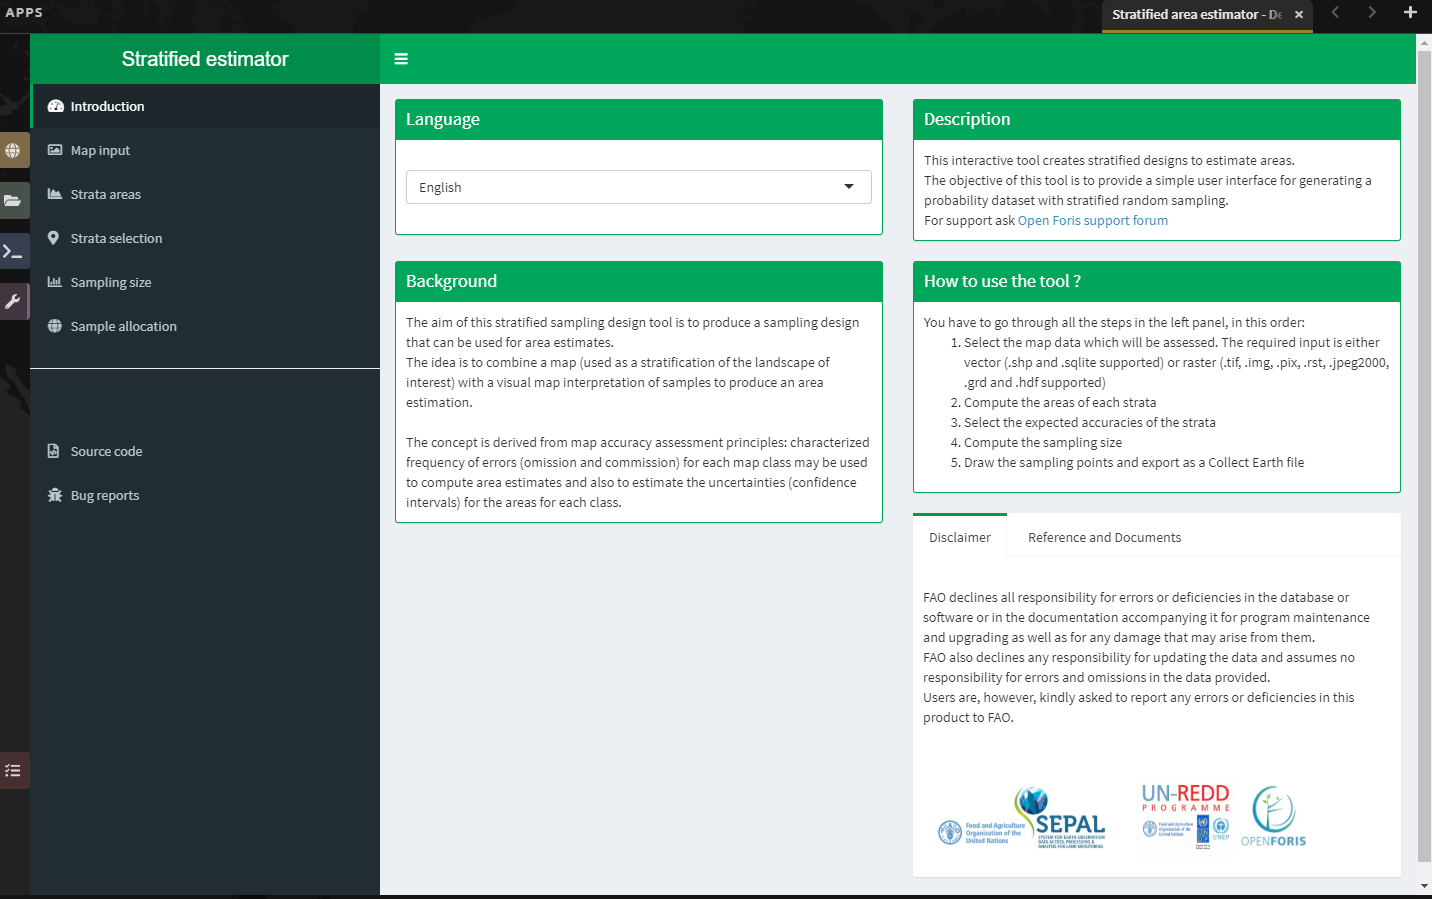
6. The steps necessary to design the stratified area estimator are located on the left side of the screen and they need to be completed sequentially from top to bottom.
7. Select Map input on the left side of the screen.
a. For this exercise, we’ll use a previously generated 10-m classification map of Liberia for 2014. However, you can substitute another classification.
b. In the Data type section, click Input.
c. In the Browse window that opens up, navigate to the classification map and select it.
d. Then click Select.
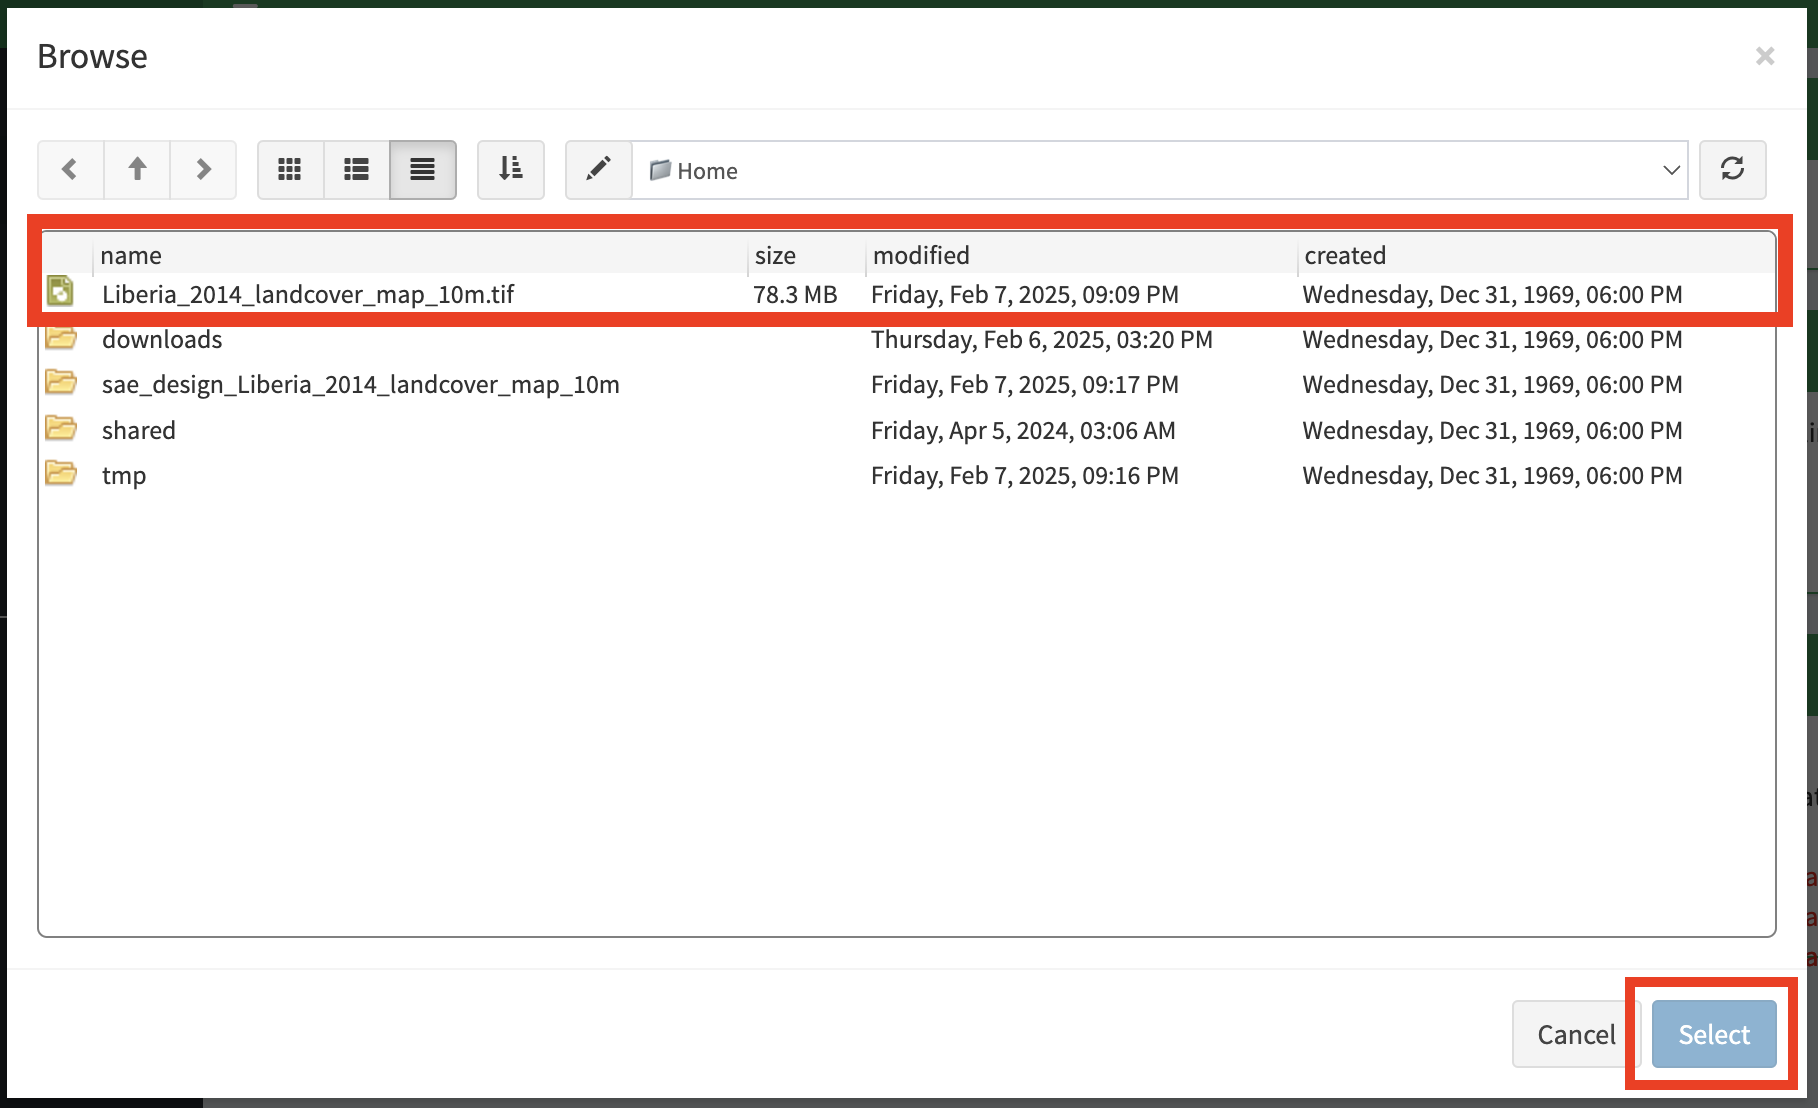
NOTE:
The Output folder section shows you where in your SEPAL workspace all the files generated from this Exercise will be saved.
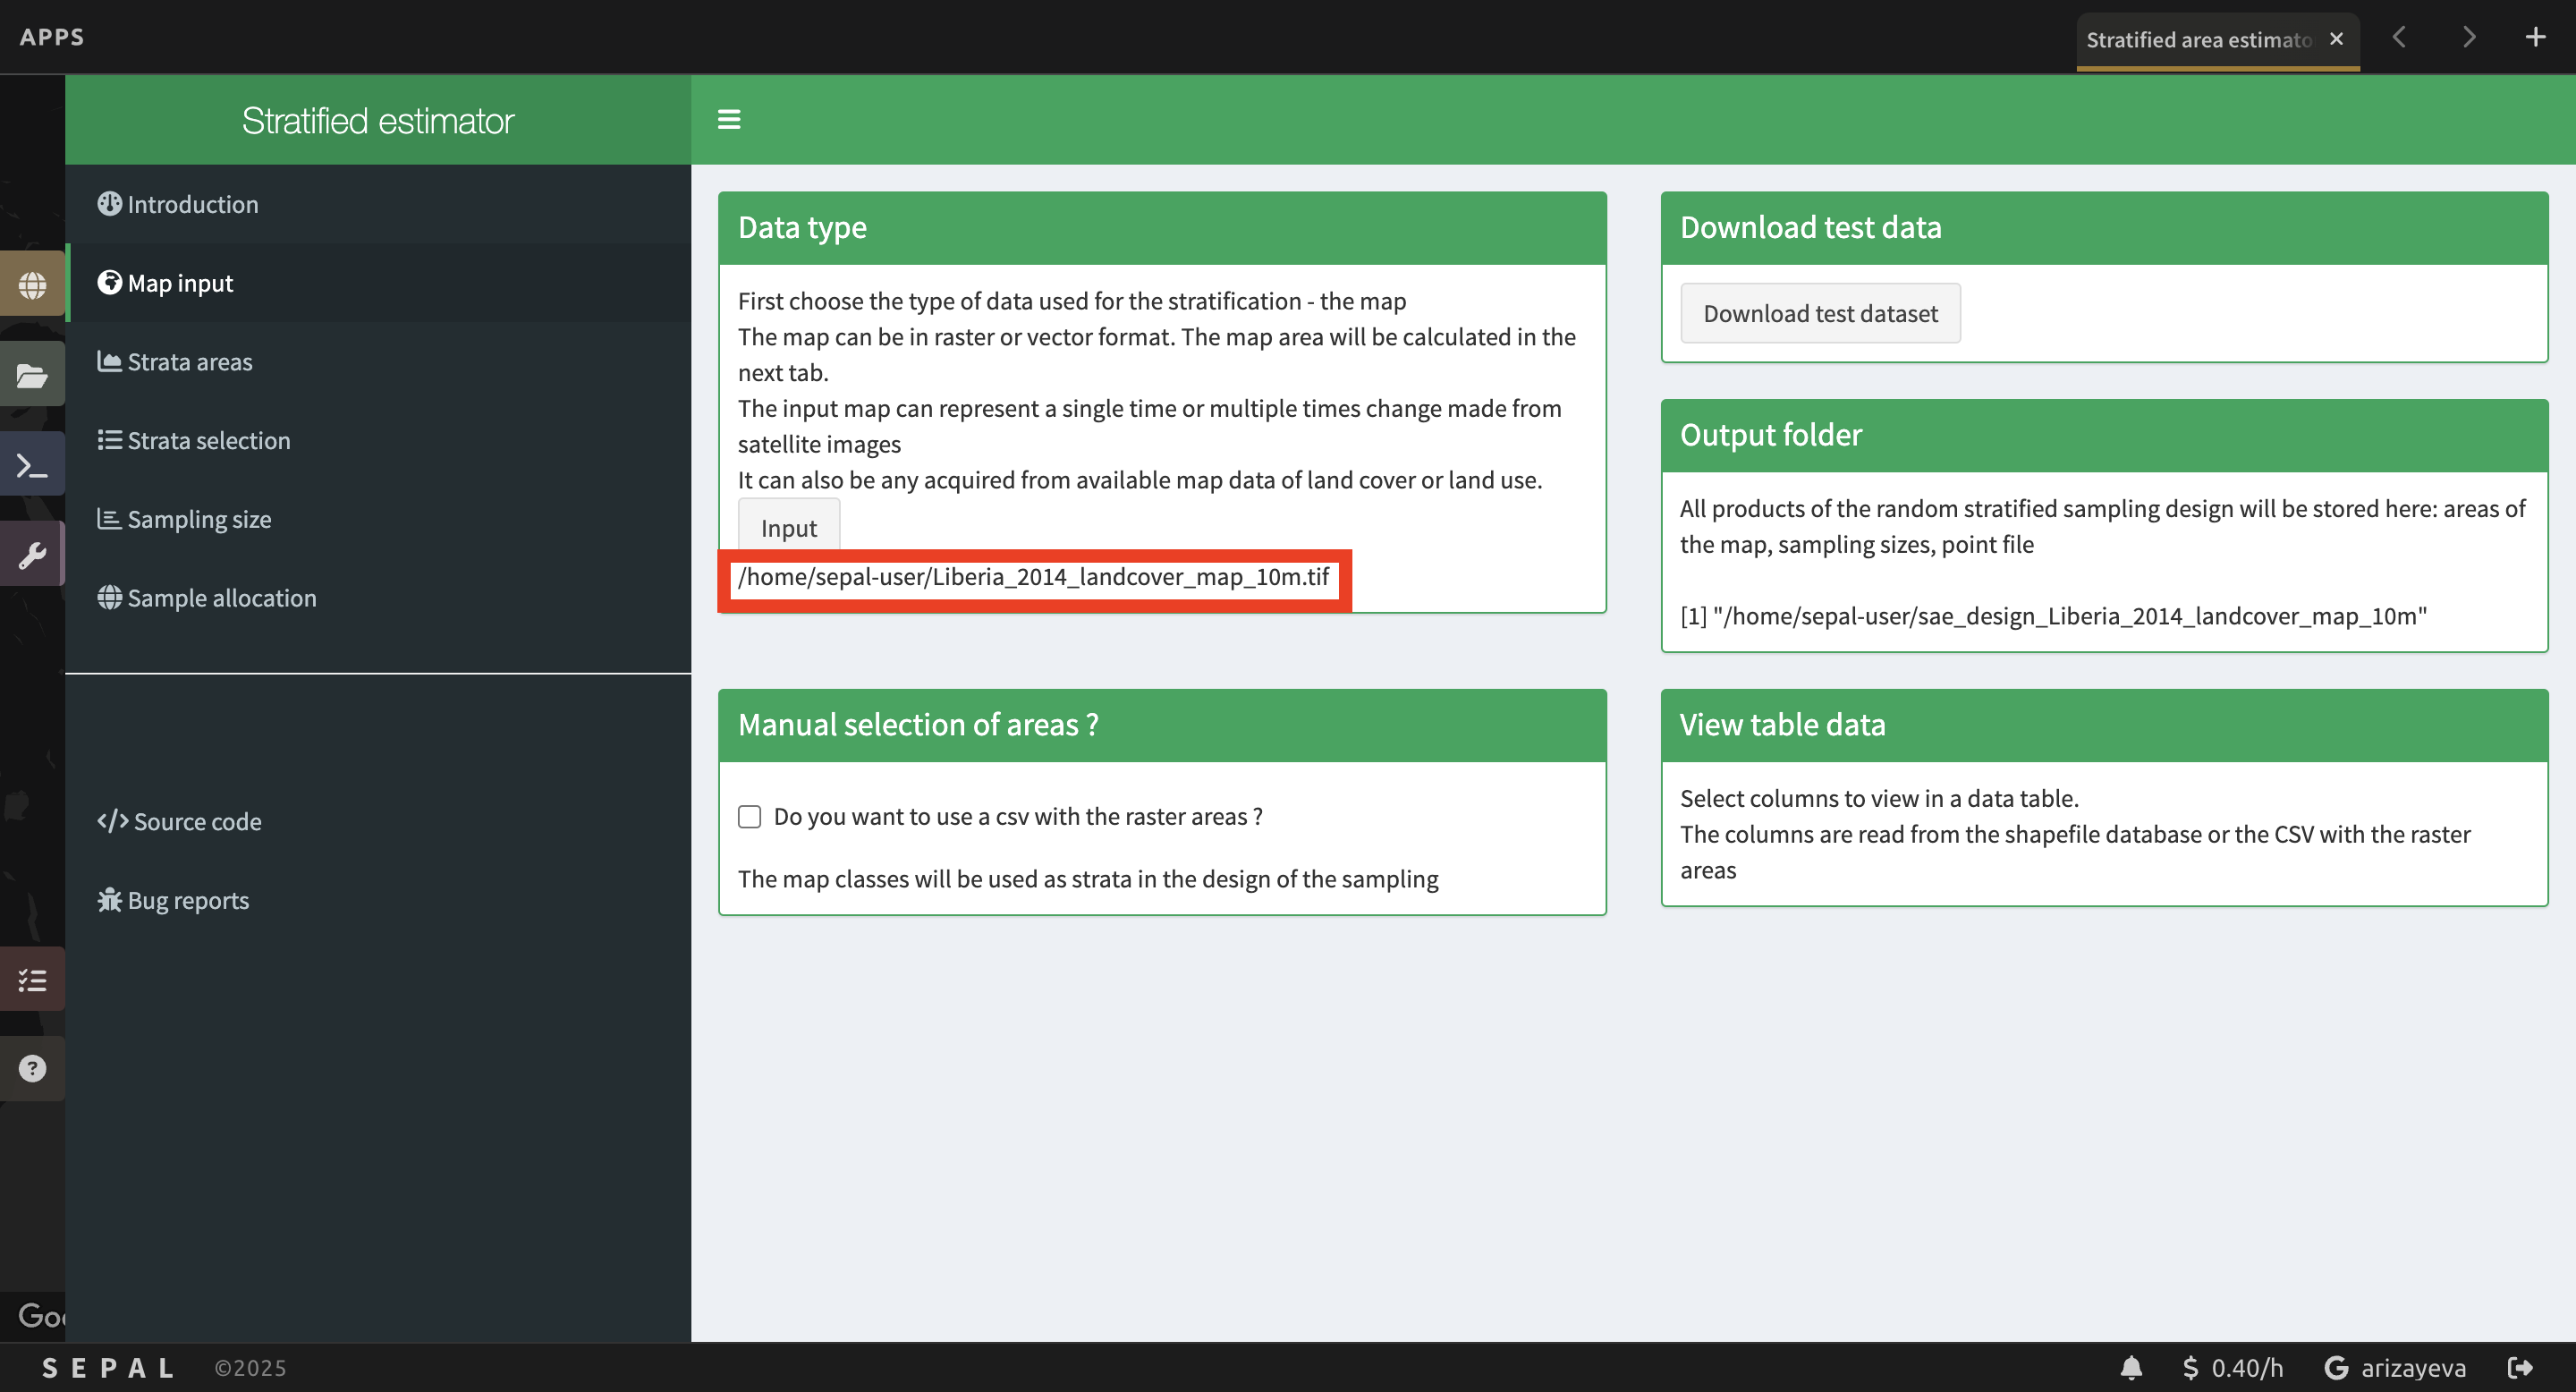
Optional:
You can use a csv with your raster areas instead. We won’t discuss that here.
8. Next, click Strata areas on the left side of the screen.
a. In the Area calculation section, click “Area calculation and legend generation”. This will take a few minutes to run. After it completes, notice that it has updated the Legend labeling section of the page.
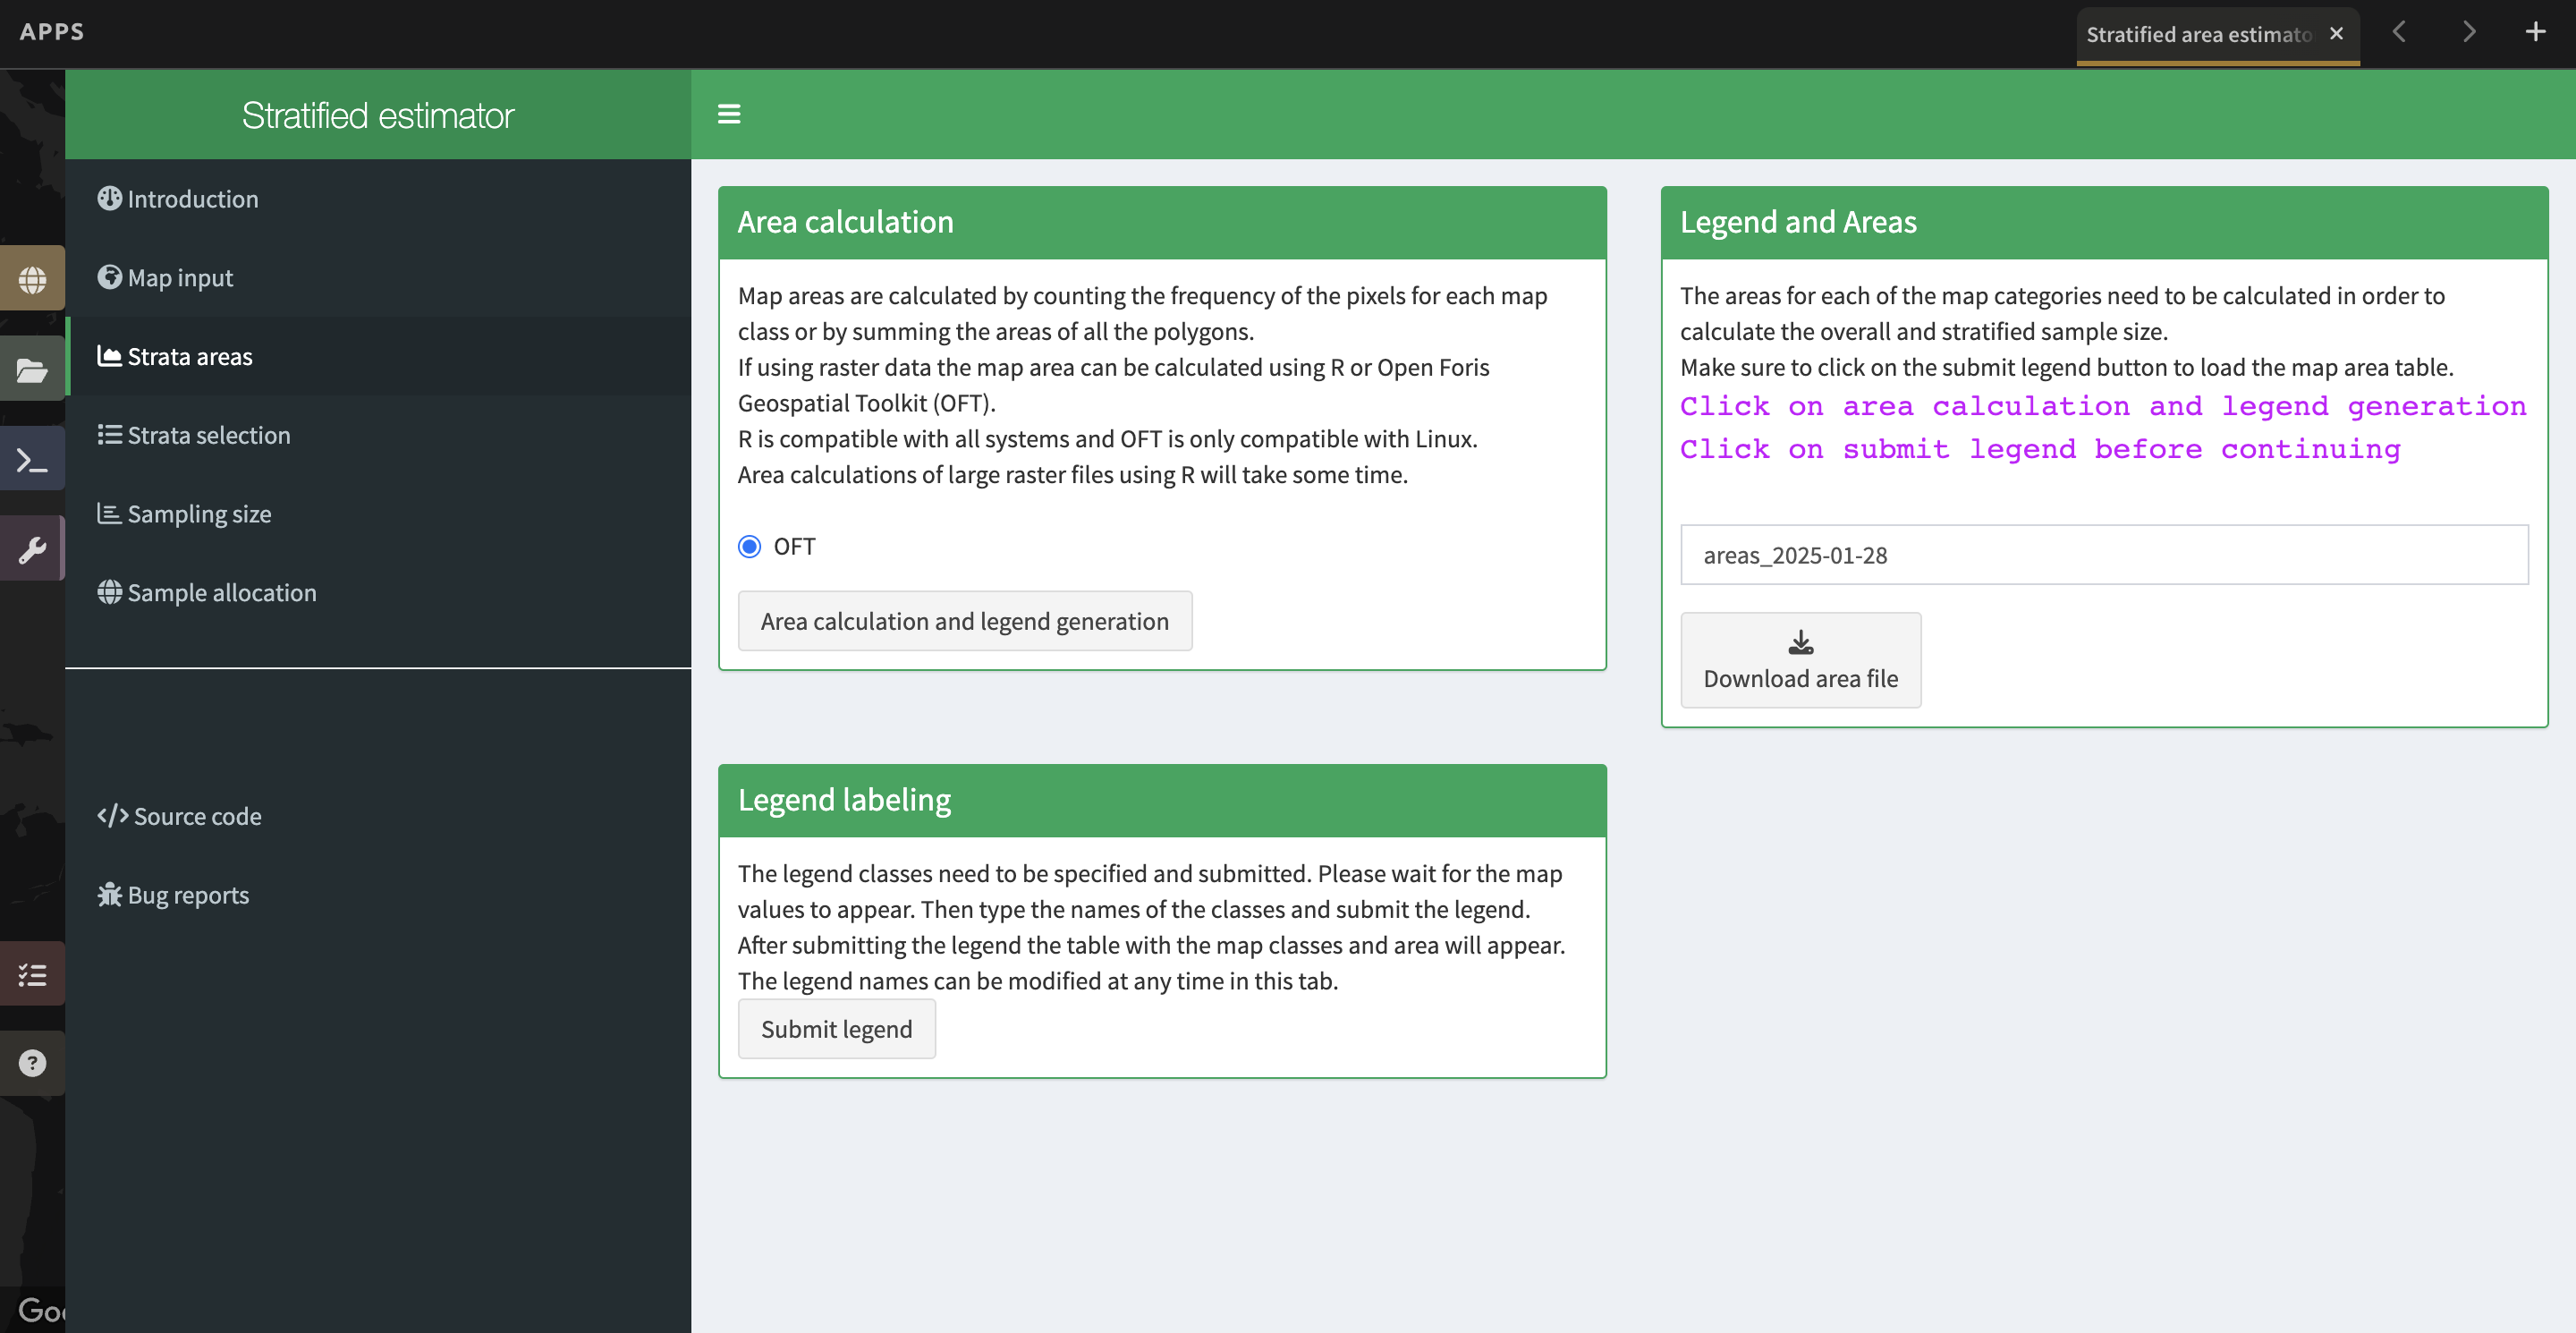
b. Next, you will need to adjust the class names in the Legend labeling section. Type in the following class names in place of the numeric codes for your Liberia map:
| Numeric code | Class name |
|---|---|
| 0 | nodata |
| 1 | forest_80 |
| 2 | forest_30_80 |
| 3 | forest_30 |
| 4 | mangroves |
| 5 | settlements |
| 7 | water |
| 8 | grassland |
| 9 | shrub |
| 10 | baresoil |
| 11 | sand |
| 25 | clouds |
c. Now click Submit Legend. The Legend and Areas section will now be populated with the map code, map area, and edited class name.
d. Always compare the Display map with the Legend labeling values returned to make sure they match.
e. You can now Rename and Download the area file if you would like. However it will save automatically to your Sepal workspace.
9. When you’re done, click on Strata selection on the left panel.
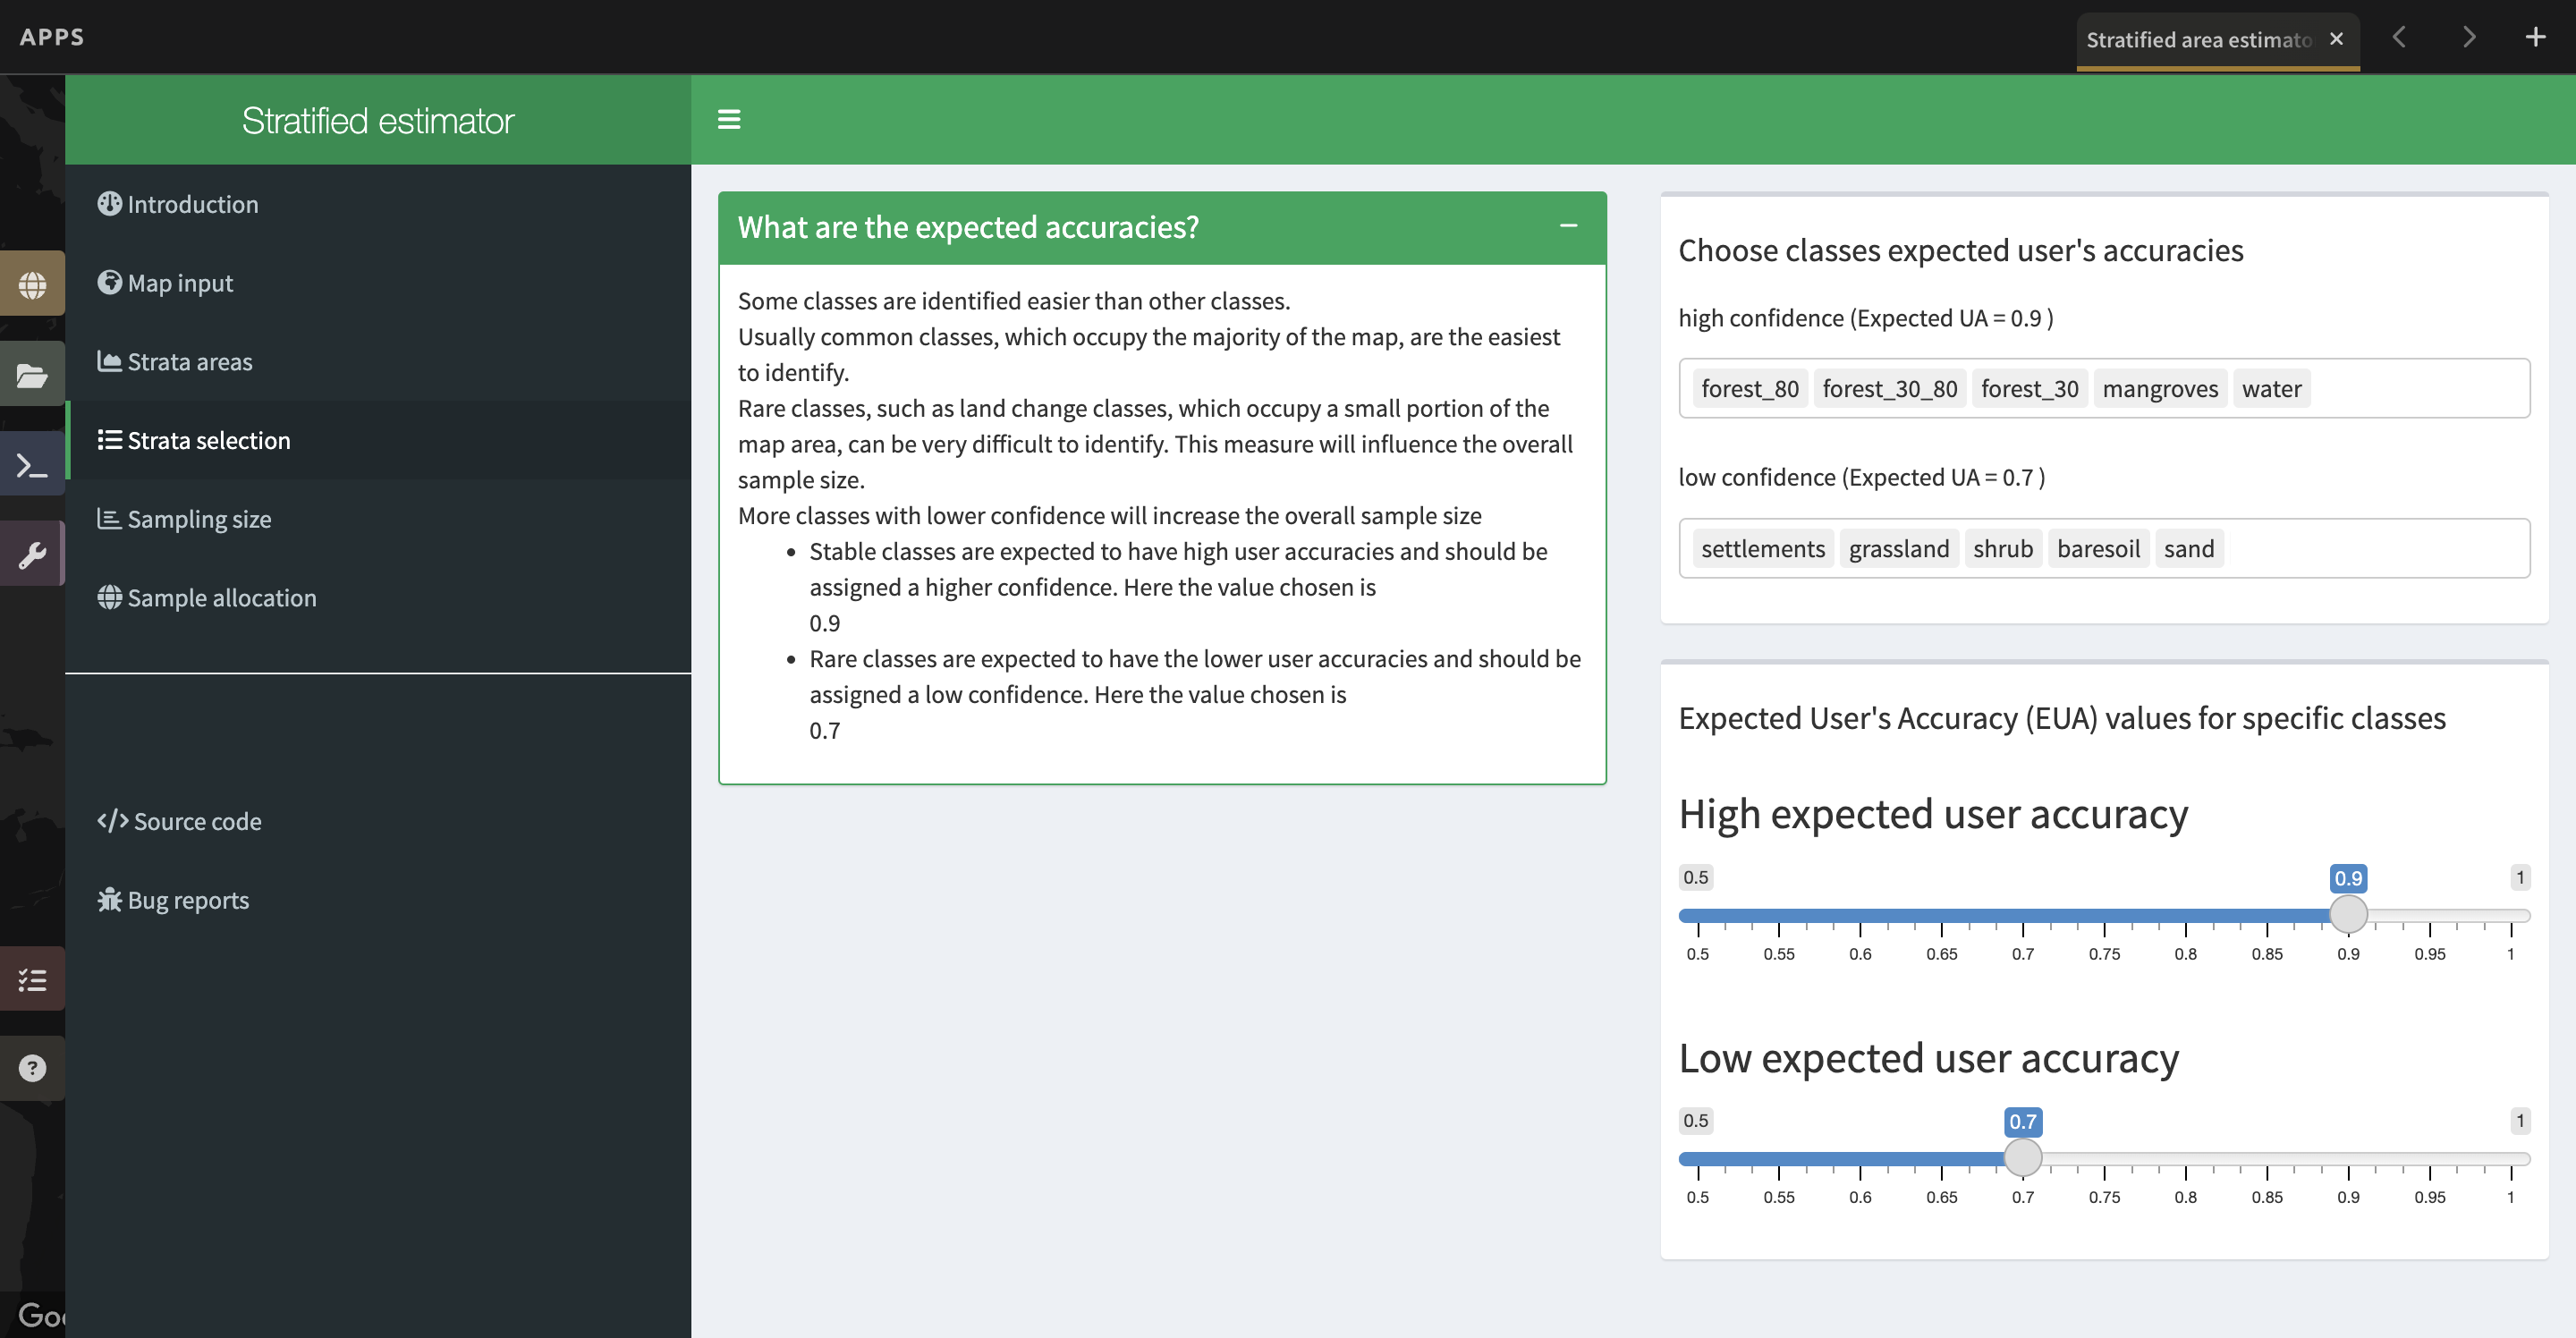
a. Now you need to specify the expected accuracies. You will do this for each class.
i. You can get more information by clicking the “+” button to the right of the box that says What are the expected accuracies?
ii. Specifying the expected user accuracy helps the program determine which classes might need more points relative to their area.
- Some classes are easier to identify–including common classes and classes with clear identifiers like buildings.
- Classes that are hard to identify include rare classes and classes that look very similar to one another. Having more classes with low confidence will increase the sample size.
iii. Select the value for classes with high expected user accuracy with the first slider. This is set to 0.9 by default, and we’ll leave it there.
iv. Then, select the value for classes with low expected user accuracy with the second slider. This is set to 0.7 by default, and we’ll leave it there as well.
b. Now we need to assign each class to the high or the low expected user accuracy group.
i. Think about your forest and non-forest classes. Which do you think should be high confidence? Which should be low confidence? Why?
ii. Click on the box under “high confidence” and assign your high confidence class(es). For this exercise, please assign the classes to high-confidence as shown in the image below.
iii. Then, click on the box under “low confidence” that appears and assign the corresponding class(es).
iv. If you make a mistake, you may use Backspace on your keyboard to remove the classes. Additionally, if you change one of the sliders slightly and, move it back, the class assignments will have been reset and you can restart the process.
c. DO NOT assign your nodata or clouds classes to either high or low confidence.
10. When you’re satisfied, click on Sampling Size on the left panel.
a. Now we will calculate the required sample size for each strata.
b. You can click on the + button next to Formula to calculate the overall sample size section to get more information.
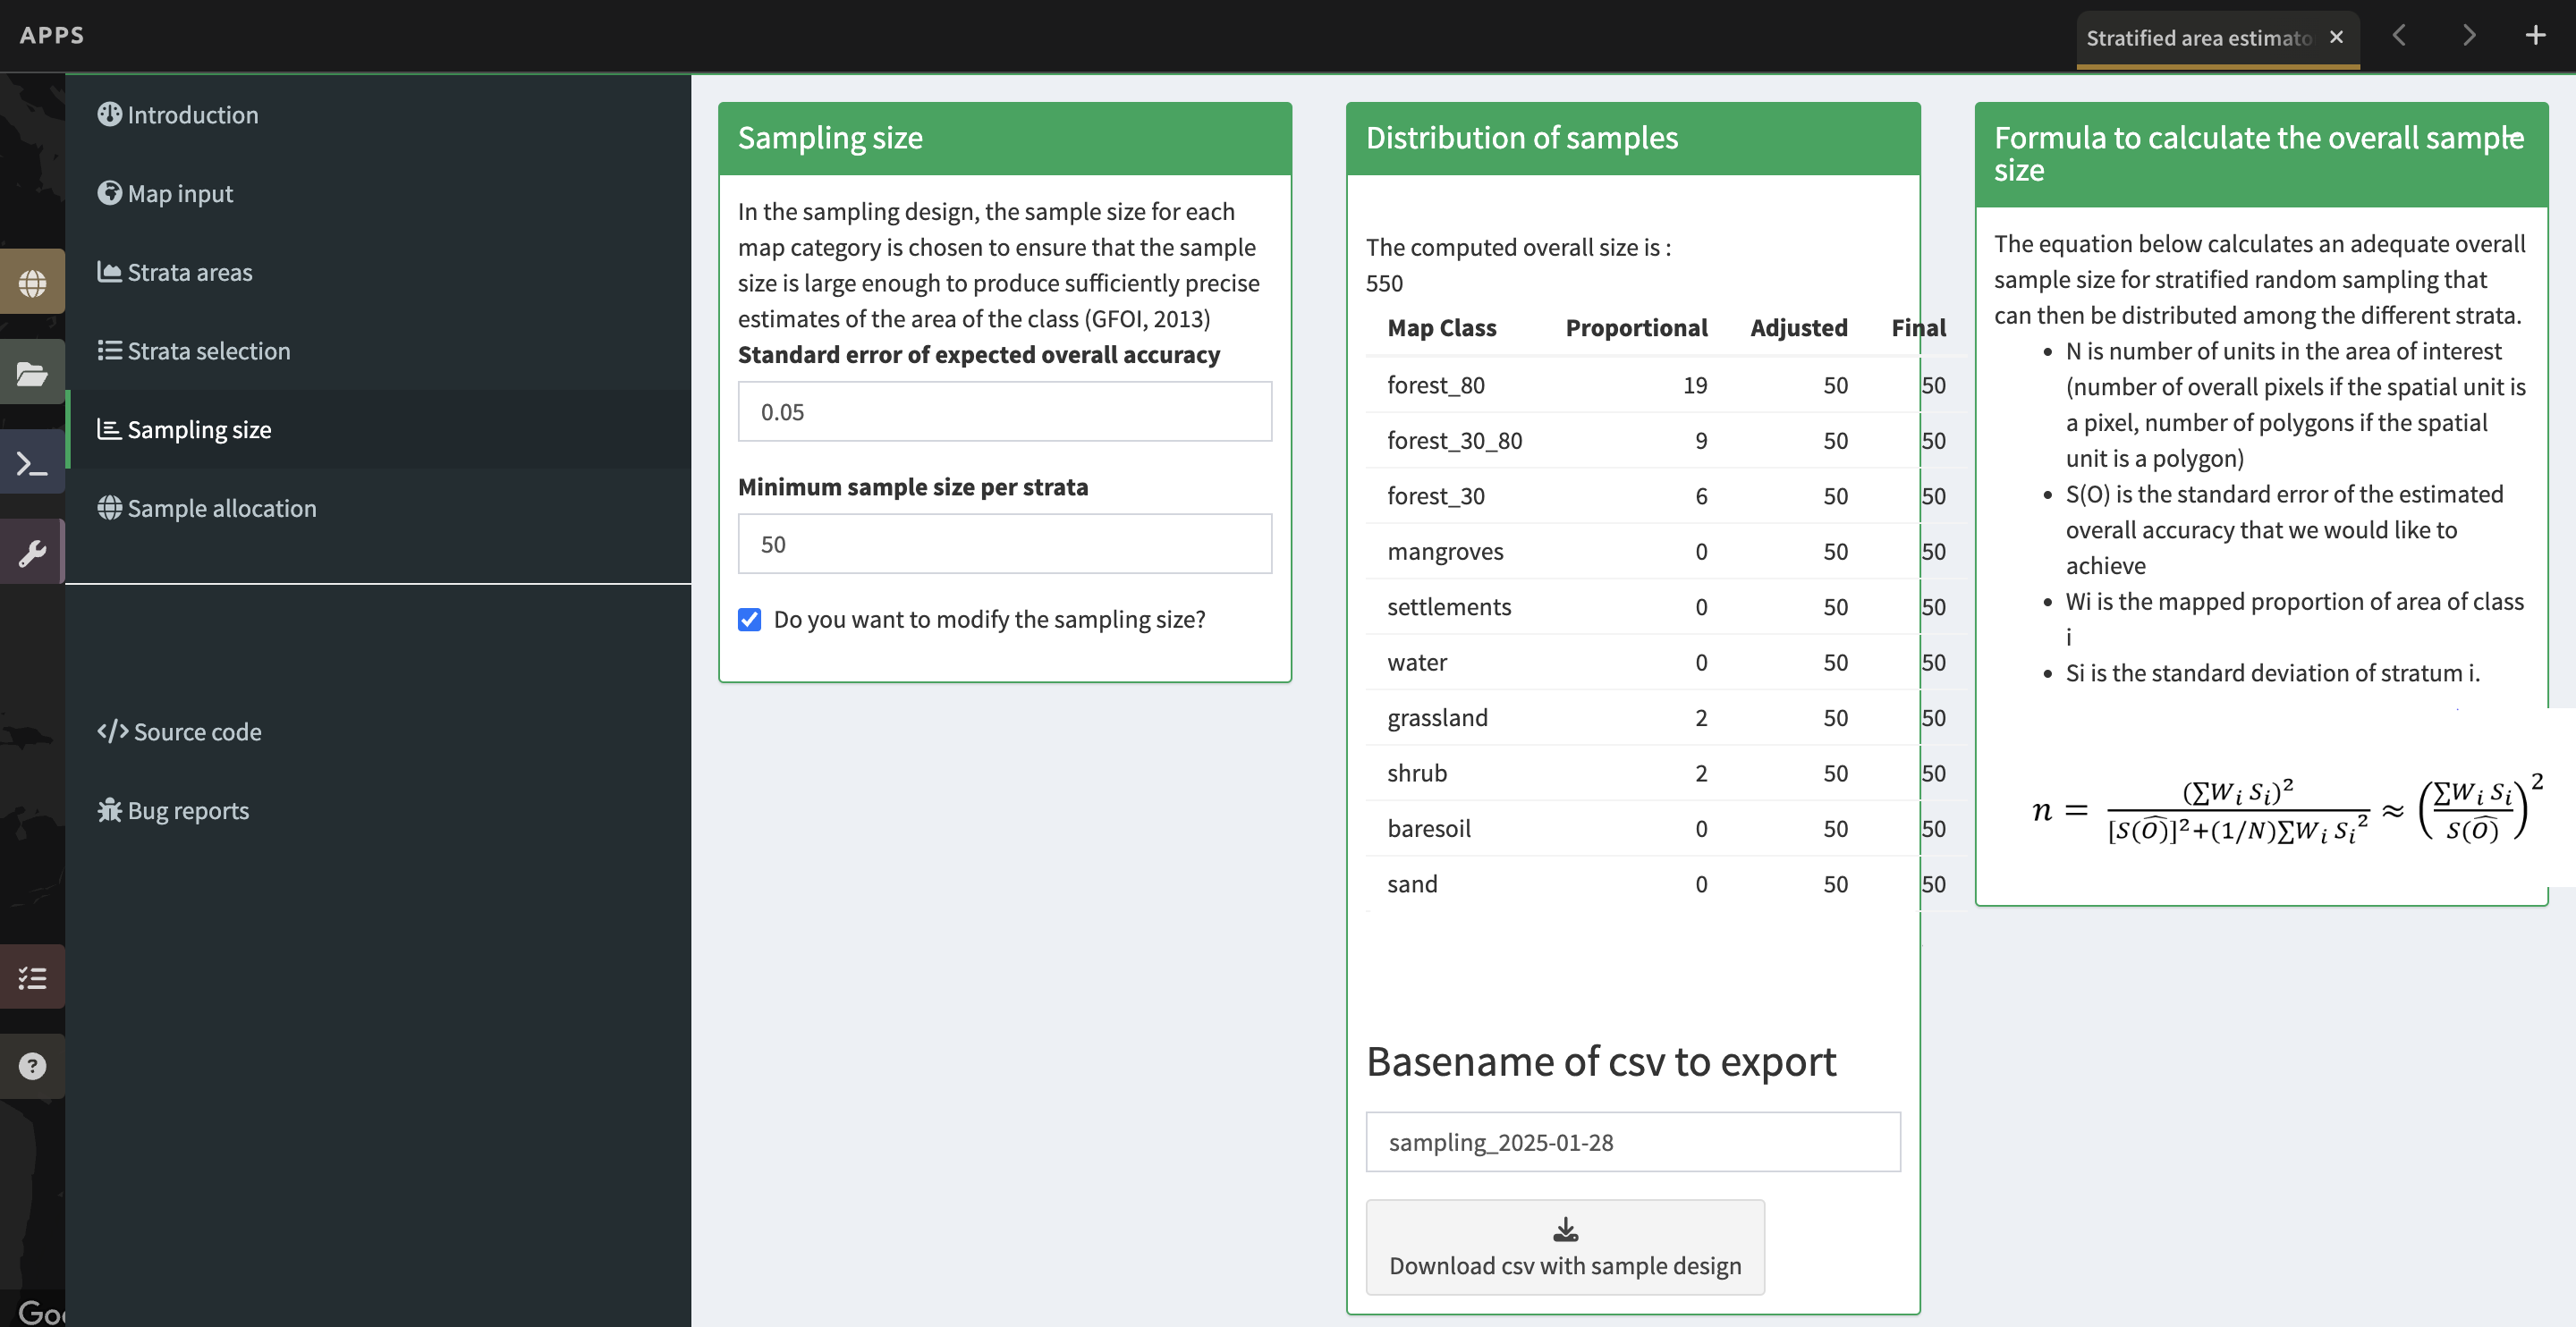
c. First we need to set the standard error of the expected overall accuracy. It is 0.01 by default, however for this exercise we will set it to 0.05.
i. This value affects the number of samples placed in each map class. The lower the value, the more points there are in the sample design. Test this by changing the error from 0.05 to 0.01, and then change it back to point 0.05. Alternatively, you can click the up/down button to the right of the number.
NOTE:
You can adjust this incrementally with the up / down arrows on the right side of the parameter.
d. Then determine the minimum sample size per strata. By default it is 100. For the purposes of this test we will set it to 50, but in practice this should be higher.
e. You can also check the “Do you want to modify the sampling size” box to update the table on the right with the new value entered in the Minimum sample size per strata cell.
- If unchecked, the table updates automatically.
- If checked, you will need to uncheck and then recheck the box for the number to update.
f. If you would like, you can edit the name of the file & download a csv with the sample design. The file contains the table shown above with some additional calculations. However SEPAL will automatically save this file.
11. When you’re ready, click on Sample allocation to the left.
a. The final step will select the random points to sample.
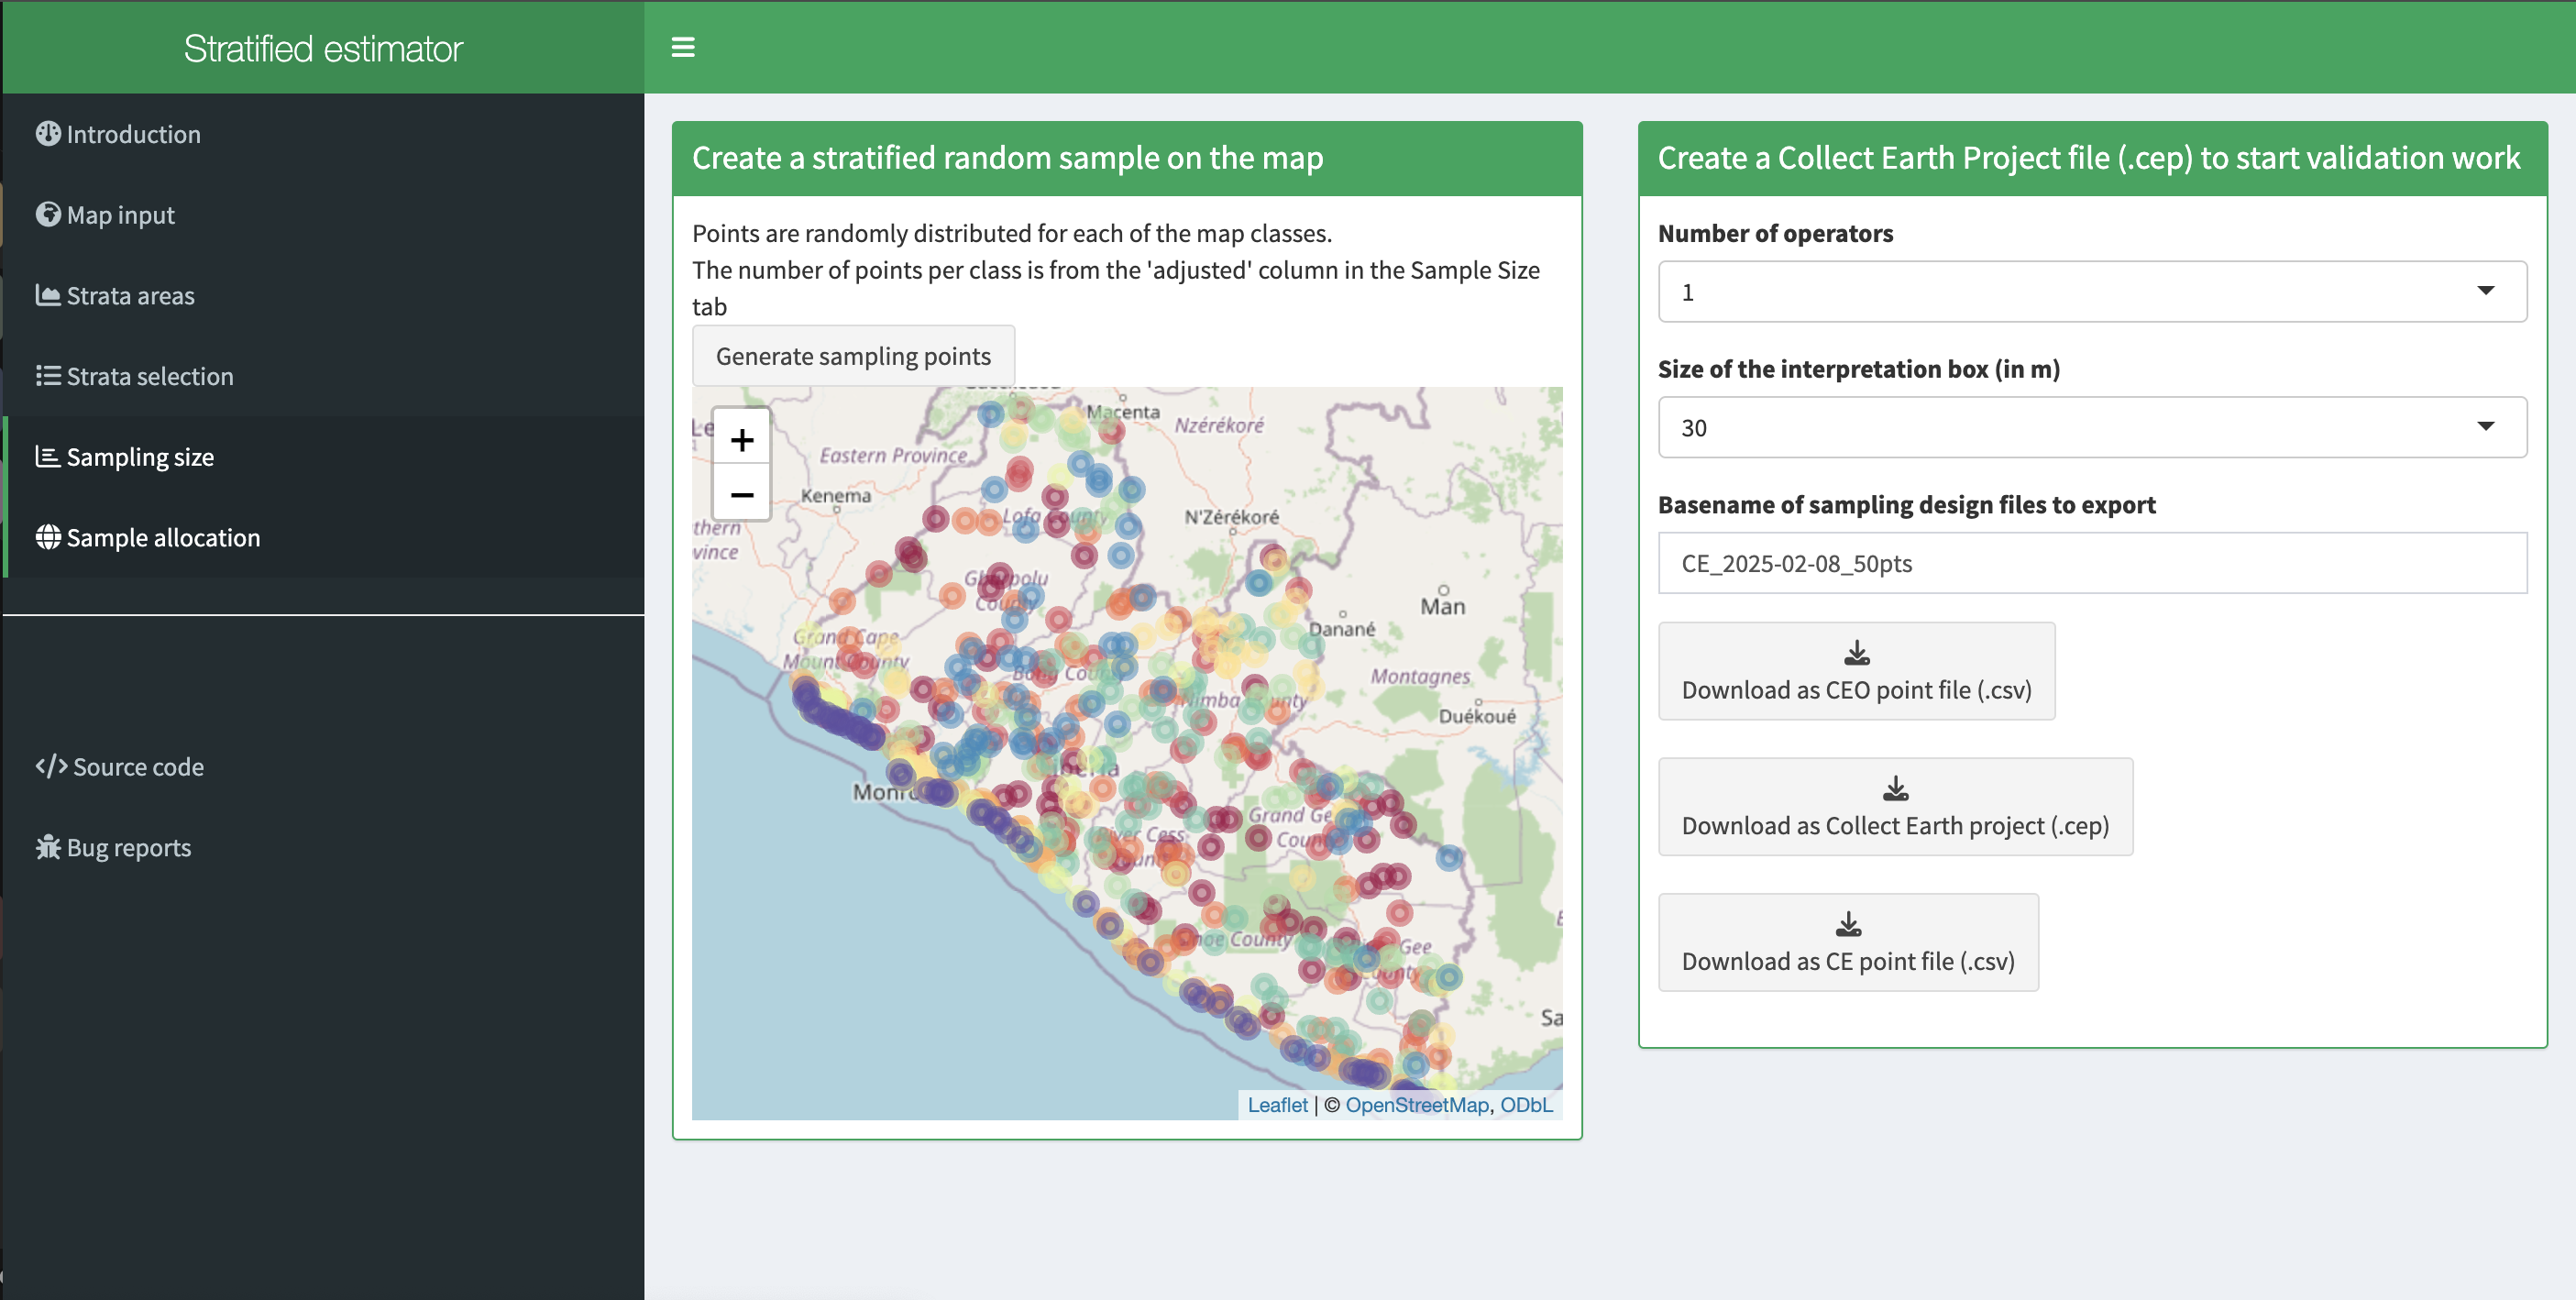
b. Select Generate sampling points and wait until the progress bar in the bottom right finishes. Depending on your map, this may take multiple minutes. A map will pop up showing the sample points. You can pan around or zoom in/out within the sample points map.
i. The resulting distribution of samples should look similar to the below image. These values will vary depending on your map and the standard error of expected overall accuracy you set.
ii. Sometimes this step fails, no download button will appear, and you will need to refresh the page and restart the process.
c. Now fill out the three fields to the right.
i. You can add additional data by specifying the number of operators, or people who will be doing the classification. Here, leave it set to 1. For CEO, this might be the number of users you think your project will have.
ii. The size of the interpretation box depends on your data and corresponds to CEO’s sample plot. This value should be set to the spatial resolution of the imagery you classified, which is 10 m in our case. However, as 30 is the lowest option available, we will keep it at 30-m.
d. Finally, download the generated files.