Accuracy Assessment
This portion of the workshop will demonstrate how to do a weighted accuracy assessment in a spreadsheet using the testing points and classification map generated in Google Earth Engine.
Follow along by copying the files editing the spreadsheets based on each step in the lesson. At the end, you will have a working spreadhseet in your own Google Drive.
Objectives
- Understand the general process for weighted accuracy assessment
- Adapt the provided workflow for a different LULC classifications with different available classes
Setup
Copy this Accuracy Assessment Folder into your own Google Drive. The files we will be using for this section are your classified testing points (.csv), your pixel areas (.csv), and an accuracy assessment worksheet (.xlsx).

If you want to work on your own computer in Microsoft Excel, make sure you have all relevant files downloaded to your computer.
Background
Map validation can be performed by comparing the map classes of representative sample points to reference labels at those locations, which are collected using human interpretation and are considered to be ‘correct’ labels for these points. If the rates of agreement between the map labels and the interpreter reference labels are very high then we can infer the map is a good representation of the mapped characteristics.
Confusion Matrix
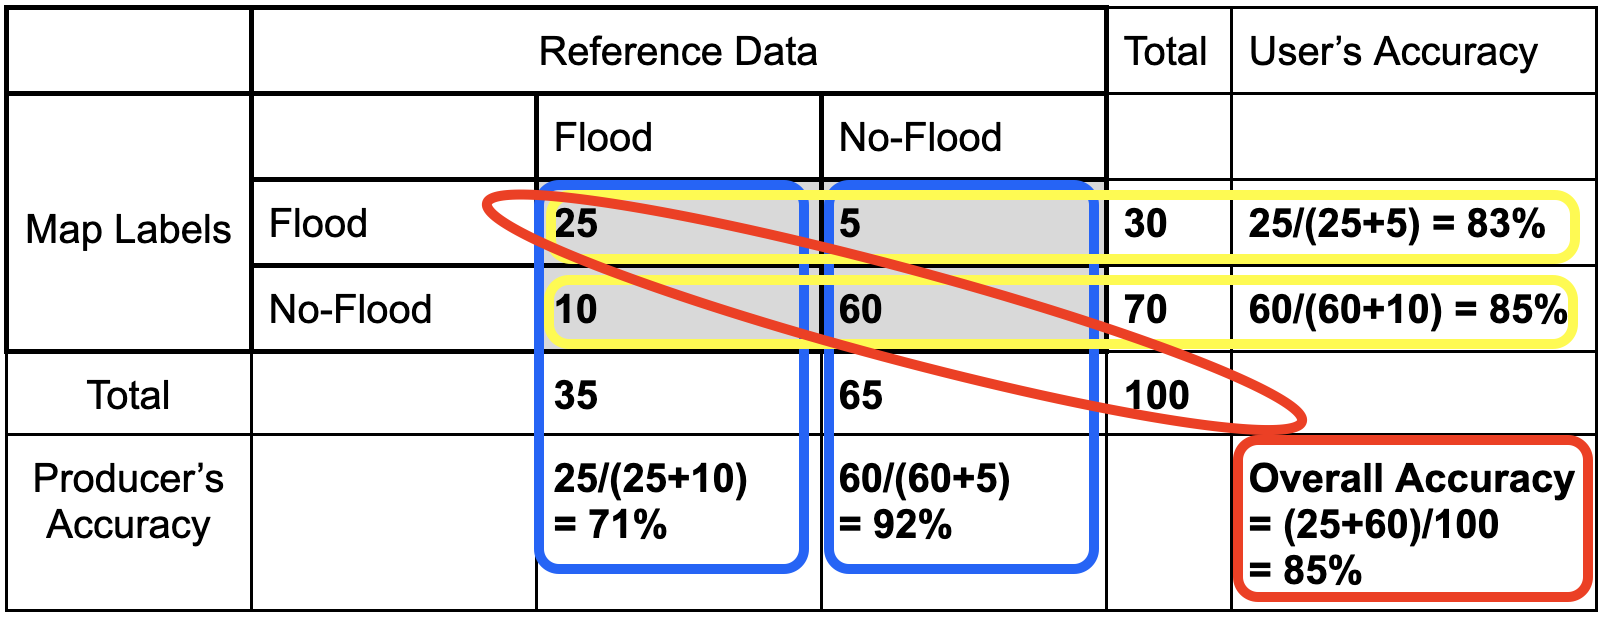
We can quantify the accuracy of the map using a confusion matrix (error matrix). The reference data dictates the actual value (the truth) while the left shows the prediction (or map classification).
- True positive and true negative mean that the classification correctly classified the labels (e.g., a flood pixel was correctly classified as flood).
- False positive and false negative mean that the classification does not match the truth (e.g., a flood pixel was classified as no-flood)

Let’s fill in this confusion matrix with example values if 100 points were collected.

Producer’s Accuracy
- The percentage of time a class identified on the ground (or by a human interpreter with remote sensing imagery) is classified into the same category on the map. The producer’s accuracy is the map accuracy from the point of view of the map maker (producer) and is calculated as the number of correctly identified pixels of a given class divided by the total number of pixels in that reference class. The producer’s accuracy tells us that for a given class in the reference pixels, how many pixels on the map were classified correctly. The percentage of time a class identified on the ground is classified into the same category on the map.
- Producer’s Accuracy (for flood) = True Positive / (True Positive + False Positive)
- Producer’s Accuracy (for no-flood) = True Negative / (True Negative + False Negative)
- On a confusion matrix, for each class it is the… on-the-diagonal value / column’s sum.
Omission Error
- Omission errors refer to the reference pixels that were left out (or omitted) from the correct class in the classified map. An error of omission will be counted as an error of commission in another class. (complementary to the producer’s accuracy)
- Omission error = 100% - Producer’s Accuracy
- (Flood) Omission Error is when ‘flood’ is classified as some ‘other’ category.
User’s Accuracy
- The percentage of time a class identified on the map is classified into the same category on the ground. The user’s accuracy is the accuracy from the point of view of a map user, not the map maker, and is calculated as the number correctly identified in a given map class divided by the number claimed to be in that map class. The user’s accuracy essentially tells us how often the class on the map is actually that class on the ground. The percentage of time a class identified on the map is classified into the same category on the ground.
- User’s Accuracy (for flood) = True Positive / (True Positive +False Negative)
- User’s Accuracy (for no-flood) = True Negative / (True Negative +False Positive)
- On a confusion matrix, for each class it is the… on-the-diagonal value / row’s sum.
Commission Error
- Commission errors refer to the class pixels that were erroneously classified in the map. (complementary to the user’s accuracy)
- Commission error = 100% - user’s accuracy.
- (Flood) Commission Error is when ‘other’ is classified as ‘flood’.
Overall Accuracy
- Overall accuracy = (True Positive + True Negative) / Sample size
- The overall accuracy essentially tells us what proportion of the reference data was classified correctly
- On a confusion matrix, it is the… sum of all on-the-diagonal values.
Differences between Accuracy Assessment and Unbiased Area Estimation
Note: Unbiased Area Estimation is another potential use for the samples you collect in CEO. The term is often confused with accuracy assessment because it is a similar process, but the final result is differet. For unbiased area estimation the goal is an estimate of area for each class +/- a caluclated uncertainty. For accuracy assessment, the goal is a calculation of the quality of a map.
| Accuracy Assessment | Sample Based Area Estimation |
|---|---|
| Uses samples for reference data (also called validation data) | Uses samples for reference data |
| A map is being assessed for accuracy | A map can be used for sample distribution but a map is not required |
| Result is producer’s, user’s, and overall accuracy calculations | Result is area calculations for each class +/- uncertainty |
| Always uses a confusion matrix | Uses a confusion matrix if samples were stratified |
Unbiased Area Estimation
Often we create classification or change maps to estimate the amount of area that has a certain land cover type or underwent a certain type of change.
But simply using these maps directly to calculate the areas of classes is problematic. Pixel counting approaches using a map simply sum up the area belonging to each class. However, this is not the most precise or accurate way to do this, since classification maps have errors (both small and large) - originating from data noise, pixel mixing, or poor separation of classes by the classification algorithm. Thus, pixel counting will produce biased estimates of class areas, and you cannot tell whether these are overestimates or underestimates.
Sample-based approaches use manually collected samples and statistical formulas based on the sampling design to estimate class areas (essentially scaling up the data collected in samples to the entire area of interest). They create unbiased estimates of area and can also be used to calculate the error associated with your map. These approaches help quanitfy and reduce uncertainty, making the estimates more robust.